 Products Home
位置&パワーセンサー、サーマルタイプ、校正済み

- Thermal Sensors for Beam Position Detection
- Calibrated Output when Used with a Compatible Thorlabs Console
- Options for Powers from 0.5 mW to 50 W
- Broadband Operation from the UV to IR
S440C
0.5 mW - 5 W,
30 mm Cage System Compatible
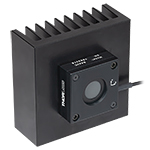
S442C
10 mW - 50 W,
Attached Heat Sink


Please Wait
| Key Specificationsa | ||
|---|---|---|
| Item # | S440C | S442C |
| Detector Type | Thermopile in Quadrant Configuration | |
| Wavelength Range | 190 nm - 20 µm | |
| Optical Power Range | 0.5 mW - 5 W | 10 mW - 50 W |
| Power Resolution | 50 µW | 1 mW |
| Position Resolution | 5 µm | 10 µm |
| Housing Features | Through Holes for 30 mm Cage System | Internal SM1 Threading, Heat Sink |
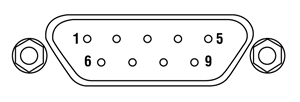
| Connector | D-Sub 9 Pin Male (C Series) | |
| Power Meter Selection Guide |
|---|
| Sensors |
| Photodiode Power Sensors |
| Thermal Power Sensors |
| Thermal Position & Power Sensors |
| Pyroelectric Energy Sensors |
| Power Meter Consoles and Interfaces |
| Digital Handheld Consoles |
| Analog Handheld Console |
| Touchscreen Handheld Console |
| Dual-Channel Benchtop Console |
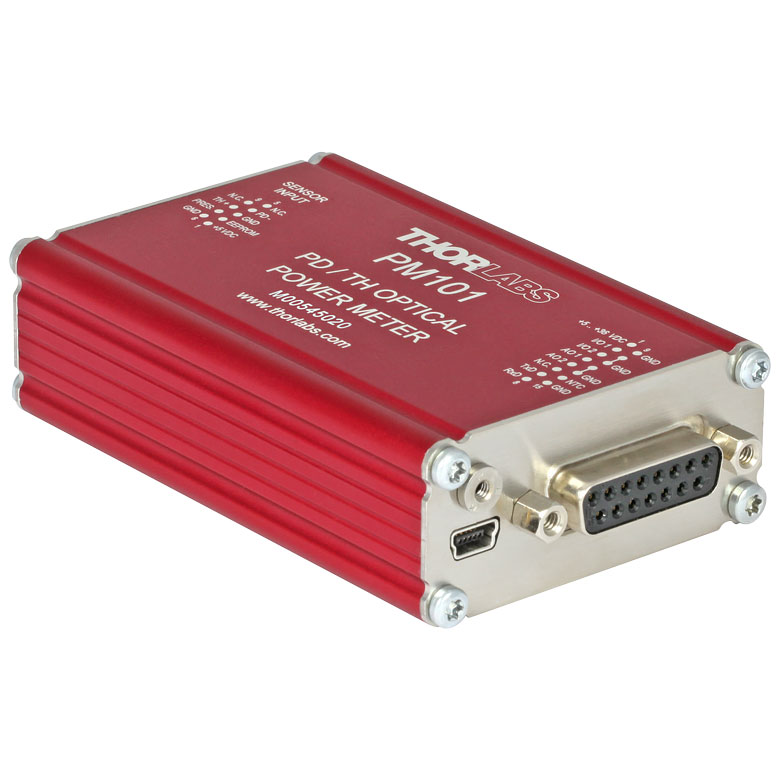
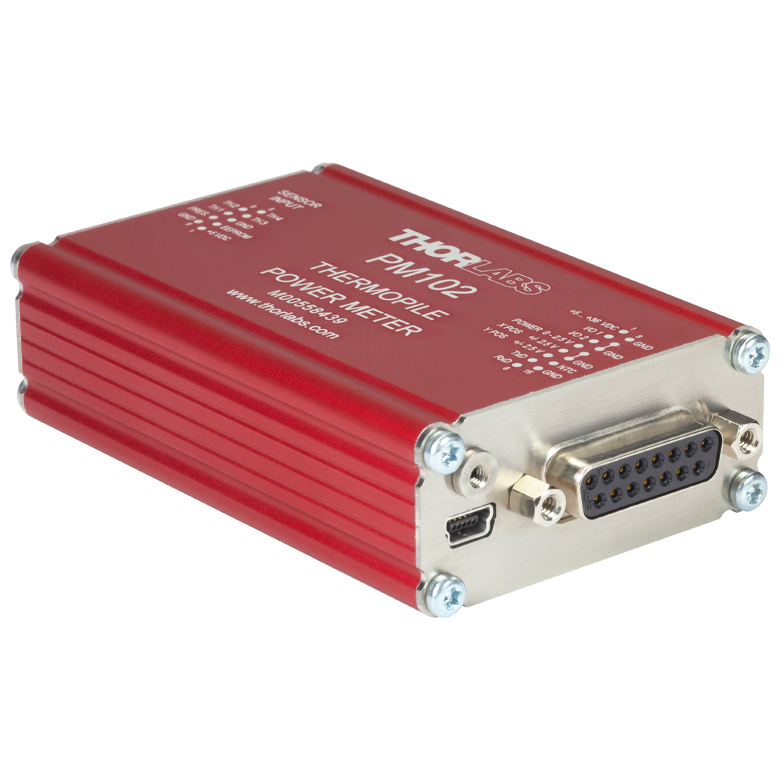
| USB Interfaces with External Readout |
| Complete Power Meters |
| Power Meter Bundles |
| Wireless Power Meters with Sensors |
| Compact USB Power Meters |
| Field Power Meters for Terminated Fibers |
Click to Enlarge
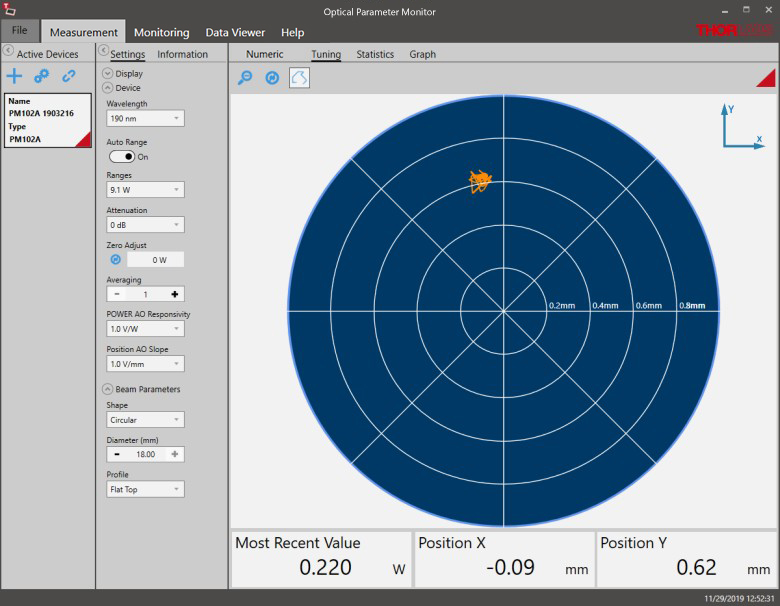
Figure 1.1 Position Tuning Mode in the OPM Software GUI
Features
- Segmented Quadrant Position Sensors
- Broad Wavelength Range with Relatively Flat Spectral Response (See Plot on Specs Tab)
- Wide Optical Power Ranges with High Precision
- C-Series Connector
- Enables Quick Sensor Connection to PM100D3, PM400, or PM5020 Consoles, or PM102 Series Interfaces
- Embedded EEPROM Contains Sensor and Calibration Data
- Post Mountable via 8-32 / M4 Universal Taps
These position sensors use thermopile sensor elements to obtain high-resolution measurements of a beam's position and power. They incorporate our OEM thermal position detectors, which consist of four sensor quadrants that calculate the beam's position by comparing the intensity measured in each quadrant. See the Operation tab for details.
The S440C detector uses the TD4HR18XP PCB-mounted thermopile sensor and is optimized for high sensitivity. The housing features four Ø6 mm through holes for compatibility with 30 mm cage systems, as well as an 8-32 / M4 universal tap for post mounting. The S442C detector incorporates the TD4HP18XA aluminum-plate-mounted thermopile sensor and can measure power levels up to 50 W. The housing includes a heat sink for superior heat dissipation, as well as two 8-32 / M4 universal taps for post mounting.
We also offer thermal sensor heads for a wide range of applications, as well as photodiode-based position sensing detectors, which offer faster response times that make them suitable for automated alignment.
For information on recalibration services for these products, please contact Tech Support.
Compatible Power Meter Console and Power Meter Interfaces
Both detectors feature C-Series connectors and can be controlled using the PM100D3, PM400 or PM5020 power meter consoles or the PM102 series power meter interfaces (all control units sold separately). The PM100D3 and PM400 consoles feature a touchscreen display for the power and position readout and can connect to a PC using a USB 2.0 connection to run the Optical Parameter Monitor (OPM) software. The PM5020 benchtop console can read the power and position of up to two sensors and display the measurements on the touchscreen or on a PC using a USB 2.0, Ethernet, or serial connection with the OPM software. The PM102 series requires a PC with the OPM software in order to operate the sensor in a power meter system; depending on the PM102 model used, operation can be through USB 2.0, RS-232, or UART.
There are a number of different display options that can be viewed on the PM100D3, PM400 or PM5020 console display screen or in the OPM software GUI:
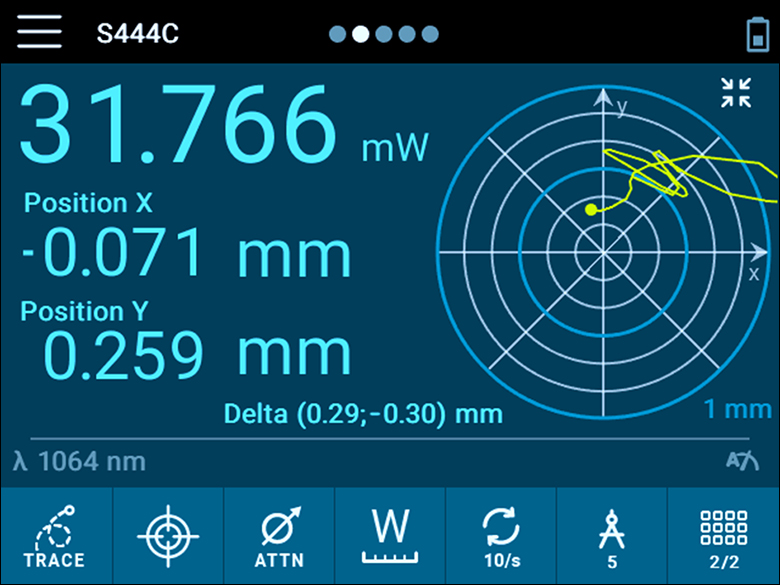
- Position Tuning: a visual representation of the beam's location on the sensor. The visible area can be adjusted between a centered Ø1 mm circle and Ø6 mm circle. The left side shows the power measured by the entire sensor surface and the X and Y coordinates of the beam. An optional setting can show a visual trace of the position over time (Position Trace Display).
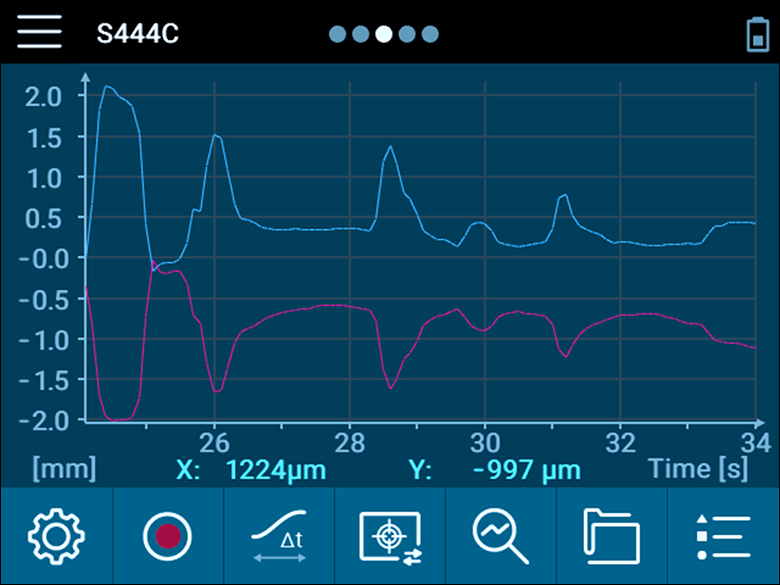
- Data Logging Graph: a graph of the X and Y positions over time, or a graph of total power over time. The user can touch a single button to toggle between the position and power graphs.
- Data Logging Statistics: a table of measurement statistics. The unit takes a number of sequential samples and then displays the mean, median, standard deviation, and more. The logged data is shared between the statistics and graph views.
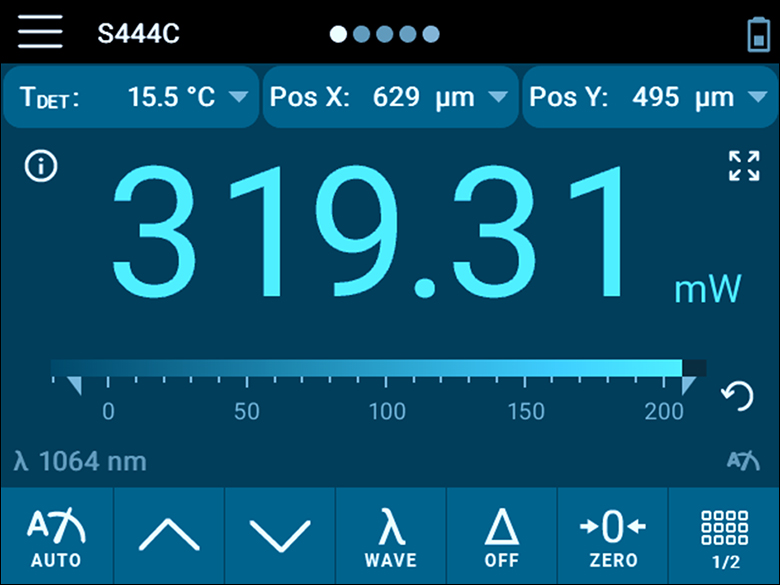
- Numerical: a digital readout of the overall power measurement for the entire sensor, displayed in W, V, or dB. The beam position coordinates are also shown in the upper right of the screen.
See the PM100D3 or PM400 full web presentations and the PM100D3 and PM400 manuals for more information on the touchscreen power meter consoles and the PM5020 full web presentation and manual for more information on the dual-channel benchtop power meter console. See the PM102 series full web presentation and manual for details on the power meter interfaces.
Click to Enlarge
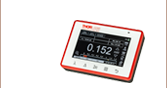
Figure 1.3 Sample Numerical Display on the PM100D3 Power Meter Console (Configurable View)
Click to Enlarge
Figure 1.2 Beam Trace Position Tuning View on the PM100D3 Power Meter Console (Only the Dot is Shown When Beam Trace is Off)
Click to Enlarge
生データはこちらからダウンロードいただけます。
このグラフのデータの波長範囲は、試験に使用したディテクタによって制限されています。サーマル位置検出器は、長波長側は20 µmまで動作可能です。
センサに関連する用語の定義についてはこちらをご覧ください。
| Item # | S440C | S442C |
|---|---|---|
| Wavelength Range | 190 nm - 20 µm | |
| Optical Power Working Range | 0.5 mW - 5 W | 10 mW - 50 W |
| Max Average Power Densitya | 1.5 kW/cm2 | |
| Max Pulse Energy | 0.3 J/cm2 (1 ns Pulse) 5 J/cm2 (1 ms Pulse) | |
| Power Resolutionb | 50 µW | 1 mW |
| Linearity | ±1% | |
| Measurement Uncertaintyc | ±5% at 1064 nm; ±7% for 250 nm - 17 µm | |
| Position Resolution | 5 µm | 10 µm |
| Position Accuracyd | 50 µm (1 mm Circle); 200 µm (6 mm Circle) | 100 µm (1 mm Circle); 300 µm (6 mm Circle) |
| Position Repeatabilityd | 15 µm (1 mm Circle); 100 µm (6 mm Circle) | 25 µm (1 mm Circle); 150 µm (6 mm Circle) |
| Response Timee | < 1.1 s | < 0.6 s |
| Coating / Diffuser | High Power Broadband | |
| Cooling | Convection | |
| Head Temperature Measurement | Thermistor (NTC) | |
| Input Aperture | 17 mm x 17 mm | Ø17.5 mm |
| Sensor Dimensions | 40.6 mm x 40.6 mm x 8.9 mm (1.60" x 1.60" x 0.35") | 100.0 m x 100.0 mm x 57.8 mm (3.94" x 3.94" x 2.28") |
| Cable Length | 1.5 m | |
| Connector | D-Sub-9 Pin Male | |
| Weight | 0.2 kg | 0.75 kg |
| Mounting Options | 8-32 / M4 Universal Tap, 30 mm Cage Rod Through Holes | Two 8-32 / M4 Universal Taps, SM1 (1.035"-40) Internal Thread, Externally Threaded SM1 Coupler Included |
| Compatible Consoles | PM100D3, PM400, and PM5020 | |
| Compatible Interfaces | PM102, PM102A, and PM102U | |
Click to Enlarge
Figure 3.1 軸方向に配列されたサーモカップルを内蔵するサーマルセンサ(図は横から見た様子)。光は上部から入射し、熱はサーモカップルの層を通過して下方向に流れ、底面のヒートシンクで放熱されます。
動作原理
これらのサーマルパワーディテクタはサーモパイル型のセンサです。センサの上層部(黒色)は光を吸収する材料で構成されています。センサのすぐ裏側に熱的に接触しているのは、複数のサーモカップルが組み込まれた層です。サーモカップルは異なる2種類の金属を接触させて作成されており、接触部はジャンクション(接点)と呼ばれています。サーモカップル層のもう一方は、ヒートシンクに熱的に結合していることが必要です。サーモカップルは直列に接続されており、それぞれのジャンクションは吸収体とヒートシンクに交互に近接して配置されています。軸方向(axial)または格子状(matrix)に配列されたサーモカップルはFigure 3.1でご覧いただけます。
吸収体は入射光のエネルギを熱に変換します。熱は吸収体からサーモカップルを通過してヒートシンクに流れ込み、そこで放熱されます。サーモカップルのジャンクションの温度は、吸収体の近くの方がヒートシンクの近くよりも高くなります。このジャンクションの配置は熱電(ゼーベック)効果をよりよく利用するためのものです。熱電効果では隣接するジャンクション間に温度差に比例した電圧が発生します。複数のサーモカップルを直列に接続することで、発生する電圧は大きくなります。
このページでご紹介している4分割ディテクタのようにサーモカップルが軸方向に配列されたセンサは、マイクロワットレベルの高い分解能とともに、比較的速い応答速度も得られます。これらのセンサは50ワットまでの光パワーを検出できますが、この上限値は主に吸収体の厚さによって制限されます。

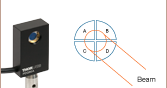
Figure 3.2 この検出器では、4つのサーモパイルセンサが四角形の4象限に配置されています。
4分割位置検出器におけるビーム位置の計算
サーマル位置検出器は2 x 2のマトリックス状に配置された4つの独立したサーモパイルセンサから構成されています(Figure 3.2参照)。 各象限のセンサは1枚のアルミニウムプレートによって機械的に結合されていますが、電気的には絶縁されています。したがって、熱はアクティブ領域全体を自由に流れますが、各象限からの電気信号はその象限のサーモパイルだけからの応答を表しています。ビームのXおよびY座標は、4つのディテクタすべての出力電圧を使用して計算します。
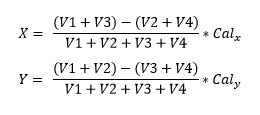
ここで、V1、V2、V3、V4は、それぞれFigure 3.2のQ1、Q2、Q3、Q4からの出力電圧信号です。センサの応答は非線形のため、ディテクタは各軸の校正係数CalxおよびCalyを使用して絶対位置を計算します。
応答特性、センサ時定数、およびパワーの予測測定
サーマルセンサの応答特性は、完全な暗闇に置かれたセンサに対して、即時的に一定強度の光を入射することで測定されます。このステップ関数的な入射光に対する応答は指数関数でモデル化でき、コンデンサを充電する様子を表す関数に類似します。Figure 3.3は、サーマル位置検出器で測定された応答特性を示しています。
センサ時定数は、センサの応答が最大応答の99%に達するのにかかる時間を用いて定義されます。 当社のパワーメーターコンソールでは次のような定義を用いています:「センサが最大応答の99%のレベルに達したとき、センサ時定数の5倍に等しい時間が経過したものとする」。Figure 3.3において、点線は99%のレベルに対応し、赤い四角はセンサ時定数で定義される時間が経過したときの応答に対応しています。センサの応答特性が時間の関数としてわかっている場合、それをモデルとして使用し、センサの読取値が安定な一定値を示す前に最終的なパワー読取値を予測することができます。
熱的外乱からのサーマルパワーセンサの保護
正確な測定結果を得るには、動作中のサーマルパワーセンサは空気の流れや熱的外乱から保護する必要があります。さもないと測定値がドリフトしてしまいます。これは高い分解能を有する低パワー用センサで特に重要です。サーマルパワーセンサを手で持って操作すると、体温がセンサやヒートシンクに伝わり、測定結果の精度に悪影響を及ぼす可能性があるため、お勧めいたしません。
Cシリーズのセンサ用コネクタ
D-Sub-9ピン、オス型
| Pin | Connection |
|---|---|
| 1 | Not Used |
| 2 | EEPROM Signal |
| 3 | Sensor Ground |
| 4 | TH3 |
| 5 | TH4 |
| 6 | EEPROM Ground |
| 7 | NTC |
| 8 | TH1 |
| 9 | TH2 |
当社では、幅広いパワーメータ&エネルギーメータ用コンソールやパワーセンサ・エネルギーセンサを操作するためのインターフェイスを取り揃えています。 主な仕様は下記でご覧いただけるので、お客様の用途に適したモデルをお選びいただけます。 下記のほかに、センサ内蔵のワイヤレスパワーメータや小型USBパワーメータもご用意しております。
当社のパワーメータ等用のコンソールやインターフェイスは、Cシリーズのセンサとお使いいただく場合は接続したセンサの種類を自動的に認識し、電流値とそれに応じた電圧値を測定します。 Cシリーズのセンサは、コネクタ内に感度特性の校正データが保存されています。 コンソールは、入射波長に対応する感度の値を読み出し、パワーもしくはエネルギの測定値を計算します。
- フォトダイオードセンサは、入射光の光パワーと波長によって決まる電流を流します。 この電流は、トランスインピーダンスアンプに送られ、このアンプから入力電流に比例した電圧が出力されます。 フォトダイオードの感度は波長に依存するため、正確なパワーの測定値を得るためには、コンソールに正しい波長を入力する必要があります。 コンソールは、接続されたセンサから、入力された波長における感度を読み取り、測定した光電流から光パワーを計算します。
- サーマルセンサは、入射された光パワーに比例した電圧を送ります。 測定されたセンサの出力電圧とその感度特性に基づいて、コンソールは入射した光パワーを計算します。
- エネルギーセンサは焦電効果に基づいています。 したがって、エネルギーセンサは、パルスエネルギに比例したピーク電圧を送ります。 エネルギーセンサが認識されると、コンソールはピーク電圧ディテクタを活用し、センサの感度特性からパルスエネルギが計算されます。
コンソールやインターフェイスはセンサが出力する電流や電圧を表示する機能も備えています。 または、測定された電流や電圧をアナログ出力で得ることもできます。
Consoles
| Item # | PM100A | PM100D2 | PM100D3 | PM400 | PM5020 |
|---|---|---|---|---|---|
| (Click Photo to Enlarge) | 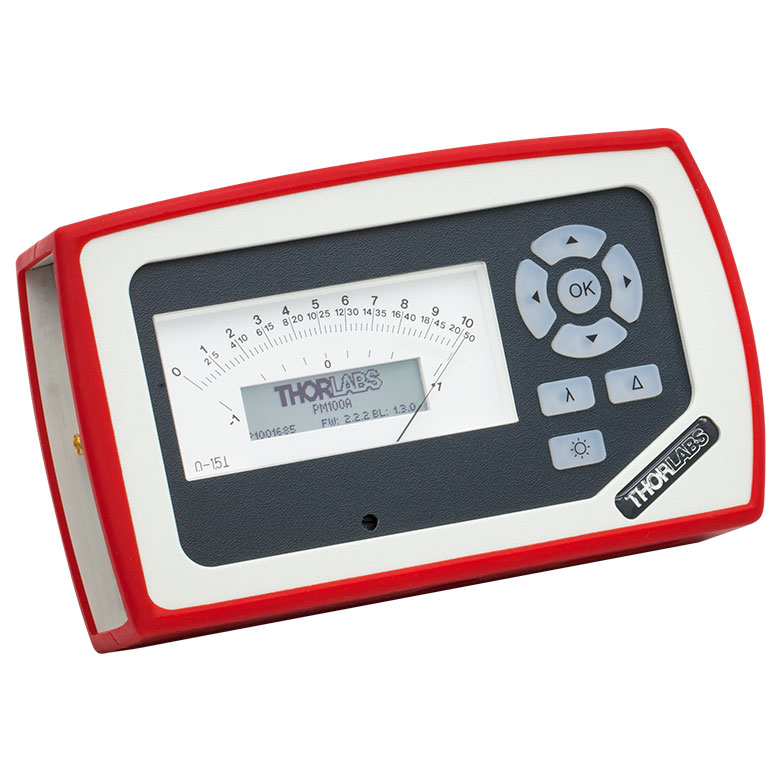 | 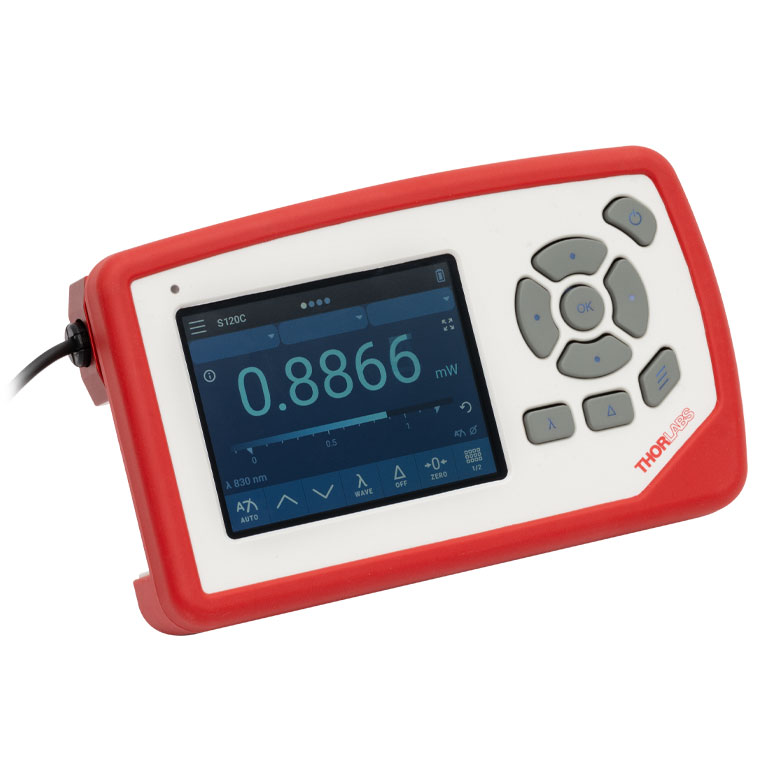 | 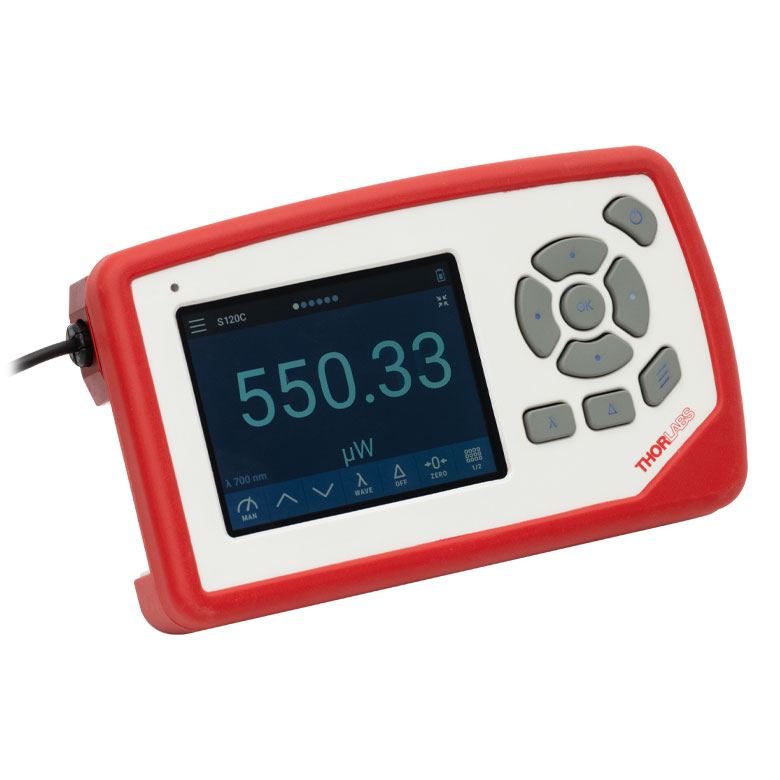 | 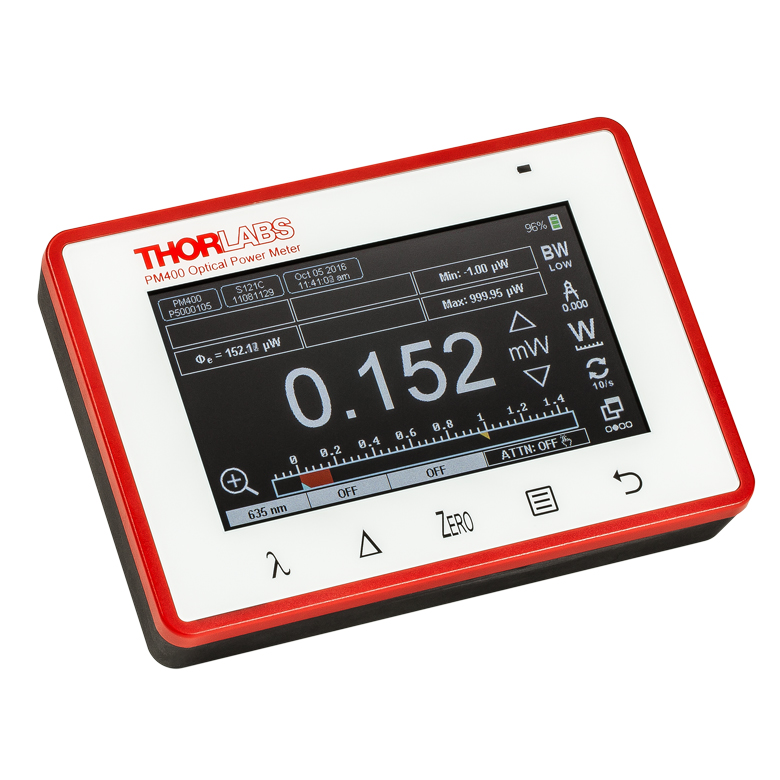 | 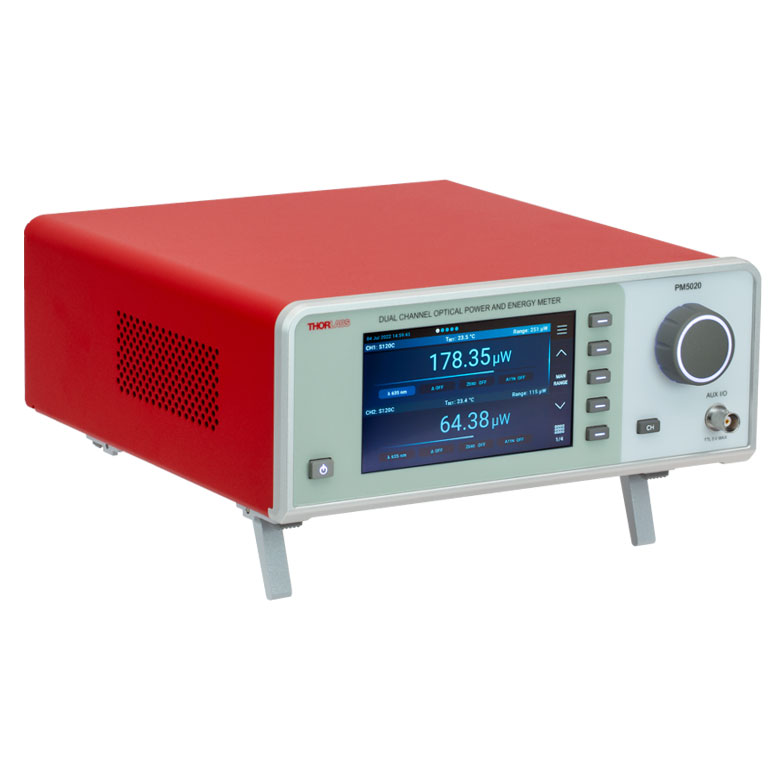 |
| Sensor Compatibility (Sensors Not Included) | |||||
| Photodiode Power |  | | | | |
| Thermal Power | | | | | |
| Thermal Position & Power | - | - | | | |
| Pyroelectric Energy | - | | | a | |
| Key Features | |||||
| Housing Dimensions (H x W x D) | 7.24" x 4.29" x 1.61" (184 mm x 109 mm x 41 mm) | 6.42" x 3.87" x 1.38" (163.0 mm x 98.4 mm x 35.0 mm) | 5.35" x 3.78" x 1.16" (136.0 mm x 96.0 mm x 29.5 mm) | 9.97" x 4.35" x 11.56" (253.2 mm x 110.6 mm x 293.6 mm) | |
| Channels | 1 | 2 | |||
| External Temperature Sensor Input (Sensor Not Included) | - | - | Readout and Record Temperature Over Time | ||
| External Humidity Sensor Input (Sensor Not Included) | - | - | Readout and Record Humidity Over Time | ||
| Analog Outputb | Amplified Input Signal, SMA, 0 to 2 V, Up to 100 kHz | Amplified Input Signal or 12-bit DAC Corrected Input Signal, SMA, 0 to 2.5 V, Up to 100 kHz | Amplified Input Signal, 12-bit DAC Corrected Input Signal, or 14-bit DAC Corrected X-Y Position Signal, SMA, 0 to 2.5 V (Power); -2.0 to 2.0 V (Position), Up to 100 kHz | Amplified Input Signal or DAC Corrected Input Signal, 2p Audio 3.5 mm (Adapter to BNC included), 0 to 2 V, Up to 100 kHz | Amplified Input Signal or DAC Corrected Input Signal, 2 x BNC, -2.5 to 10 V, Up to 250 kHz. Programmable AOc, 4 x BNC, -5 to 10 V, Up to 1 kHz |
| Input/Output Ports | - | 26-Pin AUX Connector With 4 GPIO, AN OUT for Power (Analog Input Signal and 12-bit DAC) and Position Sensor (14-bit DAC), I2C, UART, and Analog and Digital Supply Voltages | 14-Pin AUX Connector With 4 GPIO, Programmable, 2 x 10 bit ADC for External Temperature, Relative Humidity Sensor, +3.3 V, ±2.5 V (100 mA Max) | 10-Pin PCB Connector, 4 Configurable Digital I/O Channels, 1 Trigger In/Out, I2C (LVTTL / TTL) | |
| Shutter Control | - | - | - | - | Support for SH05R(/M) or SH1(/M) Optical Shutter with Interlock Input |
| Fan Control | - | - | - | - | |
| Source Spectral Correction | - | ||||
| Attenuation Correction | - | ||||
| External Trigger Input | - | - | - | ||
| Display | |||||
| Type | Mechanical Needle and LCD Display with Digital Readout | 3.5" Full Color Touchscreen Display, 640 x 480 Pixels | 4.3" Protected Capacitive Touchscreen with Color Display, 400 x 272 Pixels | 5" IPS Touchscreen LCD Display, 854 x 480 Pixels | |
| Dimensions | Digital: 1.9" x 0.5" (48.2 mm x 13.2 mm) Analog: 3.54" x 1.65" (90.0 mm x 42.0 mm) | 2.80" x 2.10" (71.0 mm x 53.3 mm) | 3.7" x 2.1" (95 mm x 54 mm) | 4.32" x 2.43" (109.7 mm x 61.6 mm) | |
| Refresh Rate | 20 Hz | 50 Hz | 10 Hz (Numerical) 25 Hz (Analog Simulation) | 25 Hz | |
| Measurement Viewsd | |||||
| Numerical | |||||
| Mechanical Analog Needle | - | - | - | - | |
| Simulated Analog Needle | - | ||||
| Bar Graph | - | ||||
| Trend Graph | - | ||||
| Statistics | |||||
| Pass/Fail | - | - | - | - | |
| Scope | - | - | - | ||
| Memory | |||||
| Type | - | eMMC Flash | NAND Flash | SD Card | |
| Size | - | 8 GB | 4 GB | 8 GB | |
| Power | |||||
| Battery | LiPo 3.7 V 2300 mAh | LiPo 3.7 V 2300 mAh | LiPo 3.7 V 2300 mAh | - | |
| External | 5 VDC via USB or Included AC Adapter | 5 VDC via USB-C Connector | 5 VDC via USB Mini B Connector | Line Voltage: 100 - 240 V | |


| Posted Comments: | |
Fabian Roeser
(posted 2025-03-26 12:22:20.913) Will there be a USB version (like the PM16-405 etc.)? Alternatively, is there an interface box capable of multiple sensor readout?
We will need 5-10 sensors and would like to omit the interface
regards jjadvani
(posted 2025-03-27 03:46:00.0) Dear Fabian, we do not currently have any plans to introduce a USB version of this sensor. However, I will include this idea in our database for future improvement. We do not have an interface box in which you may connect 5-10 sensors at the same time. You can use several interface boxes, including PM102, PM102A, and PM102U. It is possible to stack them on top of each other using accessories. I'll contact you directly to provide additional assistance Alana Horne
(posted 2025-03-26 11:52:08.863) Hello,
The position resolution for the S440C is given as 5um, however different accuracies are given for different diameters (up to 200um for the 6mm diameter). Can you explain the difference in these specifications? And can you clarify what the circle diameter in these specifications is referring to? jjadvani
(posted 2025-03-27 06:22:46.0) Dear Alana, Thank you for contacting Thorlabs. Resolution refers to the smallest measurable change that the sensor can detect. Accuracy defines how close the measured value is to the actual or true value. circle diameter refers to the physical area on the sensor's surface where the beam is detected. The visible area on the sensor can range in size from a centered Ø1 mm circle to a Ø6 mm circle. I will contact you directly to provide further information. myeong kim
(posted 2024-09-12 12:54:04.87) model : s442c
I want to measure the power stability of a 1550nm 10W fiber laser over time.
How many hours can I measure 10W output?
We want to measure continuously for more than 2 hours. hchow
(posted 2024-09-12 05:15:20.0) Dear Mr. Kim, thank you for your feedback. It is indeed possible to do a long term position measurement using the S442C when paired with a compatible console/interface. I will personally reach out to you to provide more information about the capabilities of the S442C. Thank you. Justin Sayres
(posted 2024-07-07 22:02:31.803) Do you have a lens that can be mounted and be used to determine if the incident beam is centered as well as parallel? jjadvani
(posted 2024-07-08 05:40:41.0) Dear Justin, Thank you for providing feedback. The S440C contains a cage-compatible hole of 30 mm that can be used to mount a cage rod, followed by a standard cage plate and lens. After that, you can use the alignment target to see if the beam is centered. KEVIN WAGNER
(posted 2023-11-09 06:30:00.177) I am interested in this detector for an existing position sensing application. Does the software that display the position of the beam come with the basic S440C or do I need other equipment? We would like to see if it works in the exisiting system and I am wondering if we could get the equipment on loan to test? hkarpenko
(posted 2023-11-10 09:02:50.0) Dear Kevin,
thank you for your feedback.
The S440C sensor can be used in combination with one of the following power meter consoles, PM400, PM5020 or PM102. For operation a power meter console is mandatory. On the PM400 and PM5020 you can display the position sensing directly on the screen. Using the PM102 you can use our OPM software, available for download directly on our website. I will contact you directly to discuss the possibility of a loan unit with you. Alexander Nones
(posted 2023-08-09 11:15:36.823) Sehr geehrtes Thorlabs Team,
ich hätte ein Frage zu den thermischen Power Sensoren.
Wir haben z.b. einen S442C (SN:1909908) von Ihnen am 26.Mai kalibrieren lassen und im Zertifikat ist dann nur eine Abweichung bei 1064nm angeführt.
(Sensitivity as found / Sensitivity as left)
Gibt es bei den thermischen Sensoren auch ein Auflistung über den ganzen Wellenlängenbereich?
Für uns wäre interessant, inwieweit sich die gemessenen Sensorwerte innerhalb eines Kalibrierintervalls verändern?
Haben Sie hier Erfahrungswerte?
Als Beispiel nenne ich hier den S130VC Sensor, dort gibt es zusätzlich eine Übersicht, die Driftbericht heißt und genau dieses Daten enthält.
Vielen Dank im Voraus!
Mit freundlichen Grüßen,
Nones Alexander dpossin
(posted 2023-08-14 07:44:56.0) Sehr geehrter Herr Nones,
vielen Dank für Ihr Feedback. Ich melde mich bei Ihnen persönlich um die Angelegenheit zu besprechen. Vitalie Nedelea
(posted 2023-07-25 14:10:09.727) Dear ThorLabs team.
1. It will be a very useful option to "center" the position in order to measure relative displacement.
2. Zoom is missing (down to resolution limit)
3. Increasing of trace time, because the trace disappear before delay line reach the end.
Or at list all this options could be implemented in the software.
Regards. hchow
(posted 2023-07-28 04:19:54.0) Dear Vitalie Nedelea, thank you for your valuable feedback. I will let the developers know about these improvements we can make with the Optical Power Monitor (OPM) software. Daniel Hadraba
(posted 2022-02-14 12:27:20.913) Dear Thorlabs, we have purchased the thermal position sensor that is used for positioning a robot. The robot has got its own GUI and we need to implement the visualization (ideally the target) in our GUI. Is it possible to read the x,y coordinate from your sensor otherwise than using your SW?
Thank you very much for your reply.
Daniel dpossin
(posted 2022-02-16 11:15:38.0) Dear Daniel,
Thank you for your feedback. Well it is relatively easy to carry out the position data with you own ADC converter using the formula shown here: https://www.thorlabs.de/newgrouppage9.cfm?objectgroup_id=13545&tabname=pin%20diagram. Information on the pin diagram you can find here: https://www.thorlabs.de/newgrouppage9.cfm?objectgroup_id=13545&tabname=pin%20diagram. I am reaching out to you in order to clarify further points. |
Click to Enlarge
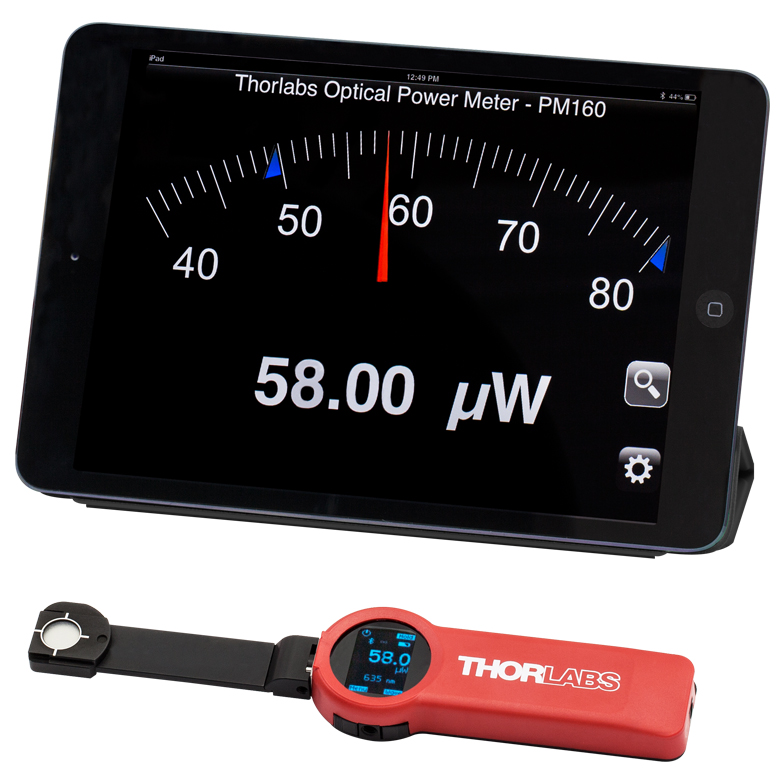
Figure 113A ワイヤレスパワーメータPM160とiPad mini(付属していません)。PM160はApple社のモバイルデバイスを使ってリモート操作が可能です。
こちらでは当社のパワーセンサおよびエネルギーセンサのラインナップをご紹介しています。対応するパワーメーターコンソールとインターフェイスについてはTable 113Bをご覧ください。
下記のパワーセンサおよびエネルギーセンサのラインナップのほかに、当社ではフォトダイオードまたはサーマルセンサのどちらかを内蔵するオールインワン型のワイヤレス機能付きパワーメータや小型USBパワーメータ、およびコンソール、センサーヘッド、ポスト取付け用のアクセサリを含むパワーメーターキットもご用意しております。
当社では4種類のセンサをご用意しております:
- フォトダイオードセンサ: フォトダイオードセンサは感度が波長に依存するので、単色光源もしくは単色に近い光源のパワー測定用に設計されています。このセンサから出力される電流は、入射光パワーと波長によって決まります。この電流はトランスインピーダンスアンプにより、入力電流に比例した電圧を出力します。
- サーマルセンサ: サーモパイルセンサは、広い波長範囲で比較的平坦な応答特性を持つ材料から作られているので、LEDやSLDなどの広帯域光源のパワー測定に適しています。このセンサは、入射光パワーに比例した電圧を出力します。
- サーマル位置&パワーセンサ: これらのセンサでは4つのサーモパイルセンサが正方形の4象限に配置されています。ユニットは各象限からの出力電圧を比較してビームの位置を算出します。
- 焦電エネルギーセンサ: 焦電センサは焦電効果を通じて出力電圧を発生しパルス光源の測定に適しています(ディテクタの時定数によって繰返し周波数は制限されます)。このセンサは、入力パルスエネルギに比例したピーク電圧を出力します。
| Table 113B Console Compatibility | |||||||||
|---|---|---|---|---|---|---|---|---|---|
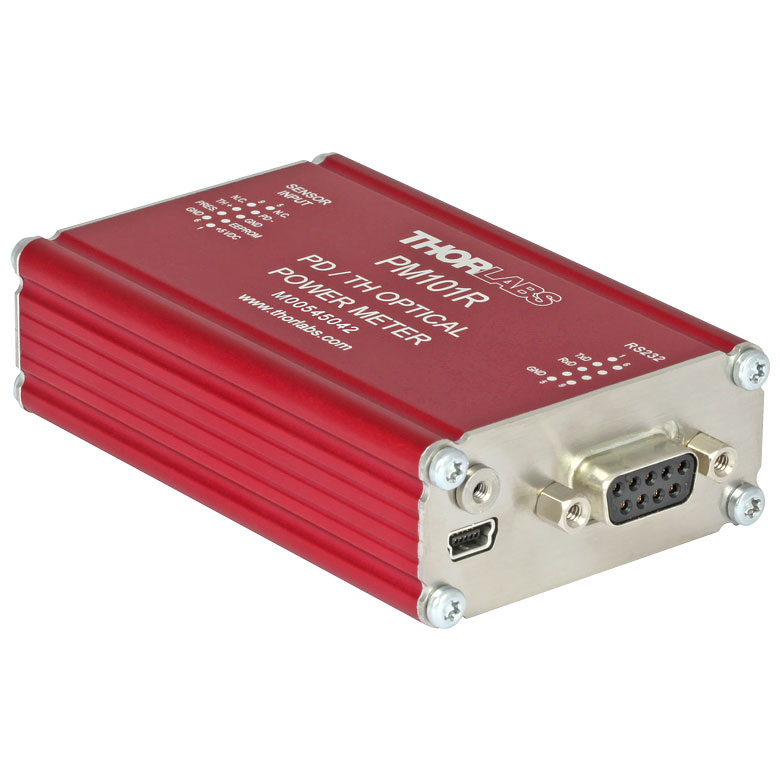
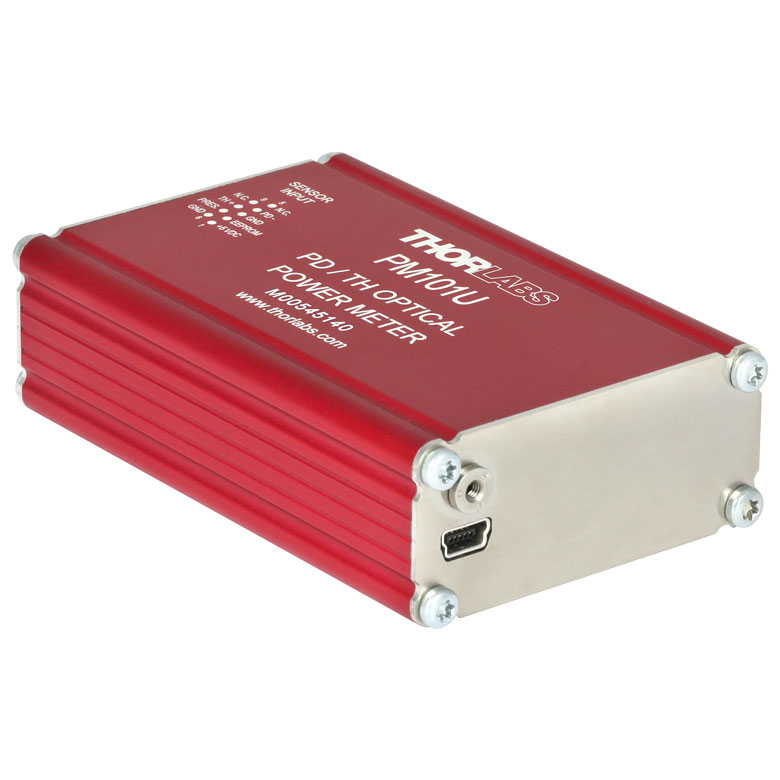
| Console Item # | PM100A | PM100D2 | PM100D3 | PM400 | PM5020 | PM101 Series | PM102 Series | PM103 Series | PM100USB |
| Photodiode Power | | | | | | | - | | |
| Thermal Power | | | | | | | | - | |
| Thermal Position | - | - | | | | - | | - | - |
| Pyroelectric Energy | - | | | a | | - | - | | a |
パワー&エネルギーセンサのセレクションガイド
当社のパワー&エネルギーセンサの仕様を比較する際には、2種類の選択をします。Table 113C、113D、113E、113Fでは、当社のセンサを種類別に分類して(フォトダイオード、サーマル、焦電)、主な仕様を記載しています。
またFigure 113Gと113Hでは、当社のフォトダイオードならびにサーマルパワーセンサの全ラインナップを波長範囲(Figure 113G)そしてパワー範囲 (Figure 113H)で比較できるようになっています。枠内には型番とセンサの仕様の範囲が記載されています。グラフにより、特定の波長範囲またはパワー範囲に適したセンサーヘッドが特定しやすくなっております。
| Table 113C Photodiode Power Sensors |
|---|


| Table 113D Thermal Power Sensors |
|---|


| Table 113E Thermal Position & Power Sensors |
|---|

| Table 113F Pyroelectric Energy Sensors |
|---|


 Figure 113G センサのラインナップ(波長範囲)
 Figure 113H センサのラインナップ(パワー範囲)