 Products Home
PPKTP結晶、SPDC(自発的パラメトリック下方変換)用

- Periodically Poled Potassium Titanyl Phosphate (PPKTP) Nonlinear Crystals Optimized for Type-0 or Type-II Spontaneous Parametric Down Conversion
- Drop-In Compatibility with Nonlinear Crystal Ovens
- Source for Polarization Entangled Photons or Heralded Single Photons from 405 nm or 775 nm Pump Lasers
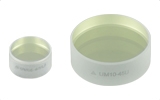
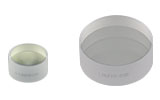
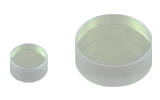
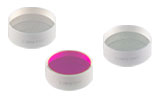
NLCK1
Mounted PPKTP Crystal, Type-0 SPDC, 405/810 nm
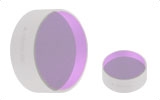
NLCK4
Mounted PPKTP Crystal, Type-II SPDC, 775/1550 nm
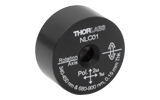
NLCH2
Oven for Nonlinear
Crystals up to 30 mm Long
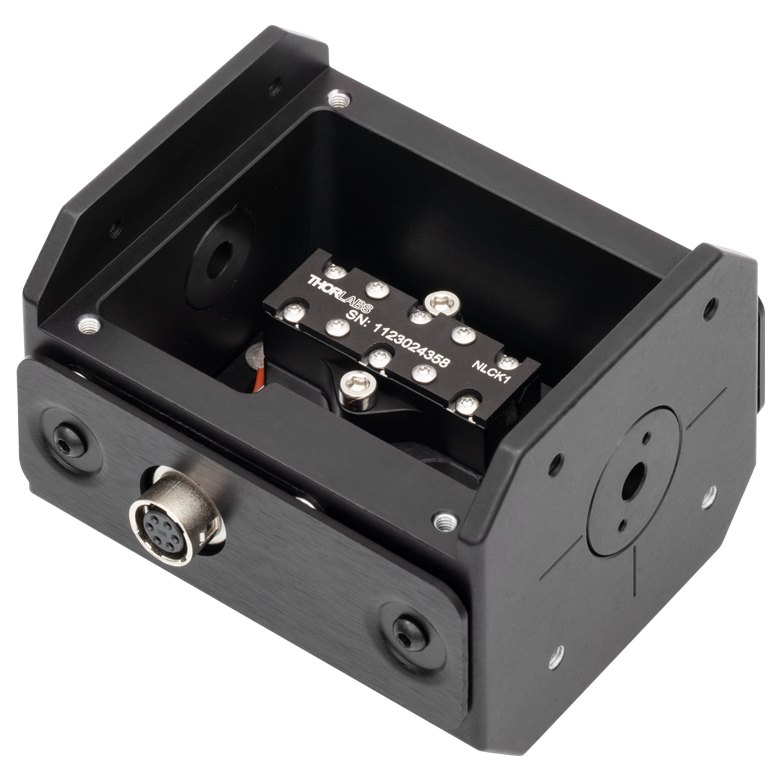
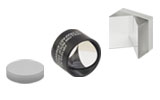
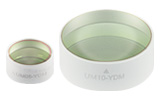
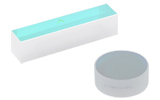
An NLCK1
SPDC crystal is
mounted in an NLCH2 oven to
adjust its temperature for tuning.


Please Wait
| Key Common Specificationsa | |
|---|---|
| Material | PPKTP (Periodically Poled Potassium Titanyl Phosphate) |
| Crystal Face Dimensions | 1.0 mm x 2.0 mm |
| Clear Aperture | > 80% of Crystal Face Area |
| Crystal Length | 30.00 mm |
| Surface Flatness | λ/6 @ 633 nm |
| Surface Quality | 10-5 Scratch-Dig |
| Phase Matching Temperature for Degeneracyb | 60 °C |
特長
- 周期分極反転構造を有するチタンリン酸カリウム(PPKTP)結晶を、自発的パラメトリック下方変換(SPDC)用に最適化
- Type-0またはType-IIのSPDC
- 405/810 nmまたは775/1550 nm
- 404.5~406 nm (型番NLCK1、NLCK2)、774~780 nm (型番NLCK3)、または765~785 nm (型番NLCK4)の励起(ポンプ)レーザ用に設計
- 当社のオーブンNLCH2/M用にカスタマイズされたホルダに取付け済み
Typical Applications
- サブショットノイズイメージング
- 2光子干渉
- 単一光子センサの特性評価
- 量子鍵配送
- 量子光学の教育用
- 伝令付き(Heralded)g(2)測定
- 吸収分光法
- 量子計測
- 導波路の特性評価
- エンタングル光子源の生成
Click to Enlarge
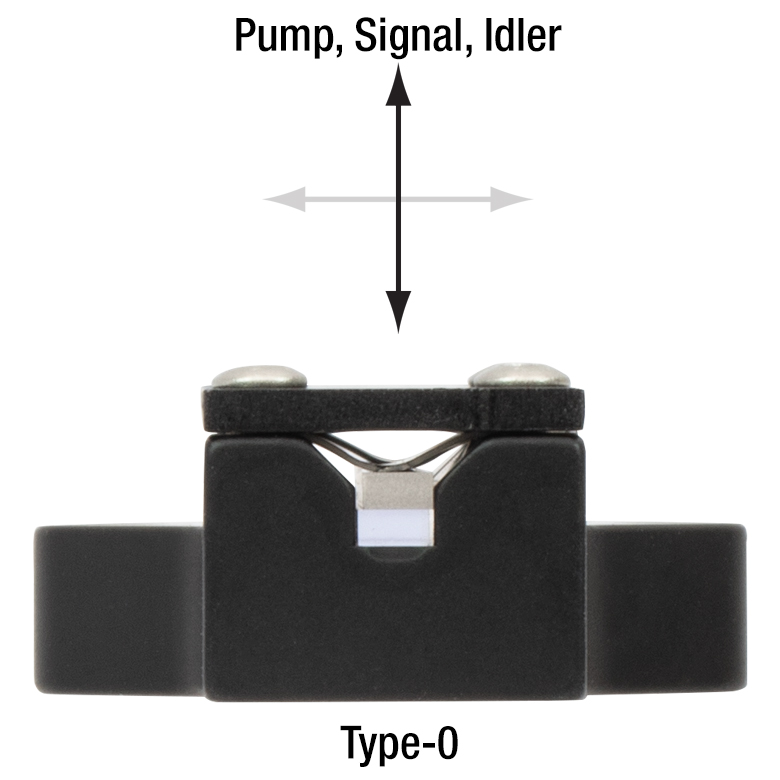
Figure 1.1 Type-0 SPDCでは、励起光、シグナル光およびアイドラ光の偏光方向は図の垂直の矢印と一致します。

Click to Enlarge
Figure 1.3 Type-II SPDCにおける励起光、シグナル光およびアイドラ光の偏光方向を示しています。
当社の自発的パラメトリック下方変換(SPDC)用PPKTP結晶は、Type-0またはType-IIのSPDC用に設計されています。この非線形プロセスでは、エネルギーの高い励起(ポンプ)光の単一光子が、エネルギーと運動量の両方を保存しながら、よりエネルギーの低いシグナル光とアイドラ光の光子ペアに周波数下方変換されます。SPDCは偏光エンタングル光子対の光源として、あるいは伝令付き単一光子源として一般的に使用されています。Type-0のSPDCによって出力されるシグナル光とアイドラ光の偏光方向は、Figure 1.1に示すように励起光の偏光方向と等しくなります。ここでは、励起光、シグナル光およびアイドラ光の偏光方向は全て垂直方向になっています。Type-IIのSPDCによって出力されるシグナル光とアイドラ光の偏光方向は、Figure 1.3に示すように互いに直交しています。SPDCについての詳細は「SPDCチュートリアル」タブをご覧ください。当社では、405 nmまたは775 nmの励起波長でType-0またはType-II のSPDCが可能な結晶をご用意しています。
SPDCは和周波発生(SFG)の逆過程であり、縮退している場合は第2高調波発生(SHG)の逆過程になります。そのため、こちらのPPKTP結晶は、第2高調波発生用に設計された結晶と非常によく似ています。 これらの結晶の周期分極反転構造により、結晶の長さが長くなるほど高い光子発生効率(より多くのシグナル・アイドラ光子数)が得られますが、一方で光子の波長と位置の相関が不明瞭になります。SPDCに最適化されたPPKTP結晶の長さはそれぞれ30.00 mmです。周期分極反転とSPDC用結晶の設計に関する詳細は、「SPDCチュートリアル」タブをご覧ください。
各結晶には、励起光、シグナル光、およびアイドラ光の全波長において低反射率(<0.5%)となるような反射防止(AR)コーティングが施されています。ARコーティングの性能については、「仕様」タブのグラフをご覧ください。
励起光子とシグナル・アイドラ光子を分離するために(特にコリニアSPDCの場合)、光学濃度の高いロングパスフィルタをご使用ください。10以上の光学濃度が推奨されますが、この濃度は一般に1枚のフィルタでは得られません。405/810 nmの結晶では可視(VIS)~近赤外(NIR)域のシグナル光子とアイドラ光子を生成しますが、この波長域ではシングルフォトン検出モジュールSPDMAなどが単一光子の実用的な検出器です。775/1550 nmの結晶で生成されるSPDC光子を検出するには、近赤外(NIR)~中赤外(MIR)域で動作するシングルフォトン検出器が必要になります。
取付けと温度制御
各結晶は、幅21.0 mm、長さ31.0 mm、高さ9.8 mmの筐体に取り付けられており、1.0 mm x 2.0 mmの結晶面の80%以上が有効な開口面になっています。これらの結晶は長いため、SPDCの効率には温度が重要な役割を果たします。当社では、これらのマウント付きPPKTP結晶をドロップインで容易に取り付けられるように設計された非線形結晶用オーブンNLCH2/M(下記参照)をご用意しています(Figure 1.2参照)。これを用いて結晶の温度を一定に保つことで、一定の効率的なSPDC光子生成を実現できます。各PPKTP結晶は、60 °Cにおいて設計波長の励起光で励起したときに縮退SPDCが得られるように最適化されているため、通常は使用するときにオーブンが必要です。これ以外の温度でもSPDC光は生成できますが縮退はしません。励起波長を調整して縮退状態に近づけたり遠ざけたりすることもできます。入射光波長と要求されるSPDC出力光の波長に応じて、結晶の温度を調整してわずかに異なる励起波長で縮退させたり、縮退させずに2つの異なる波長のSPDC光子を生成したりすることができます。SPDCの温度依存性と調整についての詳細は、「SPDCチュートリアル」タブをご覧ください。当社のすべてのPPKTP結晶の温度依存性についての詳細は、「仕様」タブをご覧ください。
使用方法および取扱い方法
PPKTP結晶は傷つきやすいため、常に手袋を装着して慎重に取り扱ってください。湿度の高い環境など、周囲の過剰な水分から保護する必要があります。高湿度の環境では、乾燥剤の使用は結晶の寿命を延ばすうえで有用です。埃の除去は、必要に応じて清潔で乾燥した空気を軽く吹きかけるだけにすることをお勧めします。手順は、光学素子の取扱いについてのチュートリアルにおける「光学素子の表面から異物等を吹き飛ばす」のセクションで詳しく説明されています。
| Item # | NLCK1 | NLCK2 | NLCK3 | NLCK4 | |
|---|---|---|---|---|---|
| Material | Periodically Poled Potassium Titanyl Phosphate (PPKTP) | ||||
| Crystal Length | 30.00 mm | ||||
| Crystal Length Tolerance | ±0.05 mm | ||||
| Poling Period | 3.400 μm | 9.925 μm | 24.650 μm | 46.025 μm | |
| Phase Matching Temperature for Degeneracy | 60 ± 10 °C | ||||
| Max Operating Temperature | 120 °C | 180 °C | |||
| Application | Type-0 SPDC | Type-II SPDC | Type-0 SPDC | Type-II SPDC | |
| Pump Wavelength at 60 °C | 405 nm | 775 nm | |||
| Signal/Idler Wavelength at 60 °C | 810 nm | 1550 nm | |||
| Temperature Tuning Sensitivitya |  |  |  |  | |
| AR Coating, Entrance Face, 0° AOI | R < 0.5% at 405 and 810 nm | R < 0.5% at 775 and 1550 nm | |||
| AR Coating Curves |  Raw Data |  Raw Data | |||
| Aperture Size | 1.0 mm x 2.0 mm | ||||
| Clear Aperture | > 80% of Aperture Size | ||||
| Mounted Height (Bottom to Crystal Center) | 5.0 mm | ||||
| Surface Quality | 10-5 Scratch-Dig | ||||
| Surface Flatness | λ/6 @ 633 nm | ||||
| Physical and Optical Properties | ||
|---|---|---|
| Material | Periodically Poled Potassium Titanyl Phosphate (PPKTP) | |
| Crystal Structure | Orthorhombic mm2 | |
| Transparency Range | 350 - 4000 nm | |
| Second-Order Nonlinear Coefficientsa | d15 = 1.95 pm/V d24 = 3.9 pm/V d31 = 1.95 pm/V, d32 = 3.9 pm/V, d33 = 15.3 pm/V | |
| Nonlinear Refractive Index (Kerr Index)b | 1.2 x 10⁻¹⁹ m2/W @ 780 nm | |
| Sellmeier Coefficients | nyc | |
| nzd | ||
| Temperature Dependencee |  | |
| Mohs Hardness | 5 Mohs | |
| Density | 3 g/cm3 | |
自発的パラメトリック下方変換の実験セットアップ

Figure 3.1 この図は、レーザL405A1からの405 nmの出力光によって生成される、自発的パラメトリック下方変換(SPDC)光子の数を測定するためのセットアップ例を示しています。レーザの出力光は、60 °Cに温度安定化された非線形結晶用オーブンNLCH2(/M)内に取り付けられたType-0の SPDC用結晶を通過します。 全てのアライメント調整ができるように、オーブンを5軸ステージPY005(/M)に取り付けることをお勧めします。直線偏光のビームは、レンズA230-Aでコリメートし、LA1484-Aで結晶に集光しています。SPDC出力光はダイクロイックミラーDMSP567で反射し、励起光はビームブロックで遮断しています。反射ビーム中にわずかに残った励起光は、ロングパスフィルタFGL715Mでフィルタリングしています。フィルタリングされたSPDC光子は、シングルフォトンディテクタSPDMAで検出します。SPDC用実験セットアップについてのその他の情報は、量子光学用教育キットのページをご覧ください。
Spontaneous Parametric Down Conversion and Phase Matching
Spontaneous Parametric Down Conversion (SPDC) is a common process for generating correlated photon pairs. In SPDC, a single pump photon generates two photons inside a nonlinear crystal, conserving both energy and momentum. These photons are created virtually simultaneously, so that one of the photons can be used to signal the existence of the other, making it possible to perform measurements on single photons. For this reason, the signal and idler photons are referred to as a herald (or heralding) and heralded photon. Additionally, degenerate type-II SPDC can be used to create polarization entangled photon pairs.
Optimizing for SPDC in our PPKTP crystals requires choosing a crystal appropriate to the wavelength of the pump laser and the appropriate temperature for the desired down conversion process. Tuning curves for each crystal offered are provided by the graphs in the Specs tab. Additional information and background, which can be helpful for interpreting the graphed data as well as more effectively using nonlinear crystals to generate down converted photons, is included in the expandable sections below. Information specific to our PPKTP crystals can be found in the section below titled How is the SPDC process tuned in periodically poled nonlinear crystals?
Click on a question to expand the corresponding passage that provides an answer, and then click again to contract the section.
What is nonlinear optics?
Click to Enlarge
Figure 4.1 A beam of light accumulates phase and is attenuated as it propagates through a linear medium, but the photons of the beam do not interact with each other. Due to this, the input (Ein) and output (Eout) electric fields have the same frequency (ω) and are directly proportional.
Click to Enlarge
Figure 4.2 This nonlinear optical medium supports second harmonic generation and the input light is the same as in Figure 4.1. In addition to providing fundamental-frequency electric fields, as in Figure 4.1, the light output from this nonlinear medium also includes frequency doubled light, whose electric field Eout(2ω) is proportional to the square of the total input electric field.
The field of nonlinear optics refers to different optical phenomena that can occur when light alters the properties of the surrounding material. These phenomena are called nonlinear optics because the strength of the material's response is proportional to the square, cube, or other higher power of the light's total electric field. Since the light usually must be intense to produce a measurable nonlinear response, laser light is often used to generate desired nonlinear effects.
A material's nonlinear response occurs in addition to the linear response, which is proportional to only the first power of the light's electric field. The interaction between the light and the material is completely conventional (linear) when optical and material conditions are not appropriate for generating nonlinear phenomena. Then, light waves in a material propagate together without affecting one another, whether or not they are part of the same beam or pulse.
An example of a material's linear response to light is illustrated in Figure 4.1, in which an input beam is described by its electric field amplitude (Ein), frequency (ω), and polarization orientation (vertical). The beam accumulates phase and experiences conventional losses from effects like reflection and material absorption before it is output, but otherwise the beam is unaffected. The total electric field (Eout) output by the material has an amplitude that is directly proportional to the that of the input beam. In addition, the input and output light has the same frequency and polarization direction.
Nonlinear processes occur when the presence of the light in the material creates conditions in which different light waves can interact with one another. In some cases, light waves from the same beam or pulse interact, and in other cases light waves with significantly different frequencies and / or polarizations interact. Nonlinear phenomena include the generation of new frequencies of light, lensing of laser light propagating in uniform materials, and modulation effects. In the case of frequency generation, the light output by the nonlinear material will include a frequency of light different than any of the input beams' frequencies.
An example of nonlinear frequency generation is illustrated in Figure 4.2, in which the light is incident on a nonlinear optical material. While the incident light is the same as in Figure 4.1, the material supports second harmonic generation, and the electric field output from this crystal includes a new color, which has double the frequency of the input beams. The amplitude of this frequency-doubled light is proportional to the square of the total input electric field, and the losses accumulated by the two fundamental-frequency beams include the photons converted into frequency-doubled light.
What is spontaneous parametric down conversion (SPDC)?

Click to Enlarge
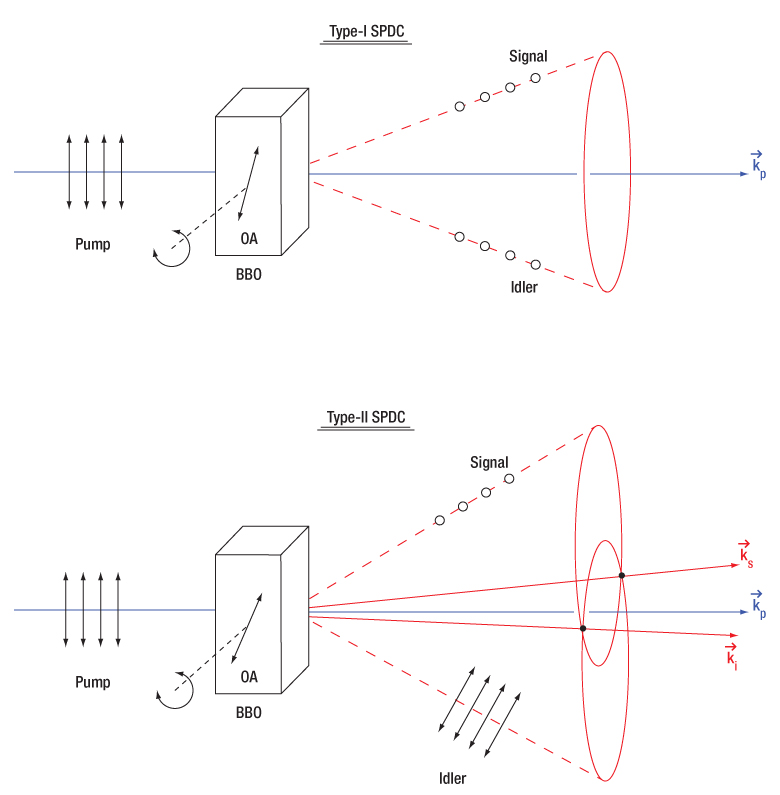
Figure 4.3 Conservation of momentum in non-collinear spontaneous parametric down conversion requires an angular deviation of the signal (ks) and idler (ki) photons to compensate for the larger magnitude of the sum of their momenta.
Click to Enlarge
Figure 4.4 The signal and idler photons emitted during spontaneous parametric down conversion form either a cone (type-I SPDC) or a pair of cones (type-II SPDC). The two intersection lines between the signal and idler emission cones in type-II SPDC (labeled ks and ki, respectively) are the wavevectors that correspond to polarization entangled photons. The optical axis (OA) of the crystal can be changed by rotating the crystal, altering the phase matching conditions. This diagram shows noncollinear SPDC emission, but collinear emission with a gaussian profile is also possible.
Spontaneous Parametric Down Conversion
Spontaneous parametric down conversion (SPDC) is the reverse process to sum frequency generation (SFG). One common example of degenerate SFG, called second harmonic generation (SHG), is used to generate 532 nm wavelength photons from a 1064 nm pump laser. Unlike SFG, however, SPDC cannot be explained by classical fields. The SPDC process is called spontaneous (as opposed to stimulated) because the photon pair is created without the presence of an external electromagnetic field at the signal wavelength. Classical theories only allow for the generation of an idler and signal beam if a weak signal beam already exists, a process called parametric amplification. Therefore, the existence of the SPDC process can only be explained with quantum mechanics.
Conservation of Energy and Momentum in SPDC
Since energy and momentum are conserved in the SPDC process, the energy and momentum of the photon being down converted must be equal to the energy and momentum of the pair of output photons. The implication of this conservation is that experimental parameters must be set up to allow for conservation of energy and momentum during SPDC or else the process cannot proceed. The following example demonstrates how this conservation determines experimental parameters such as the photon output angles, polarization states of the output photons, and the nonlinear crystal cut angle.
In general, the output idler and signal photons will have propagation directions that fall on the surface a cone (type-I SPDC) or a pair of cones (type-II SPDC), as shown in Figure 4.4. These conical emission patterns can be observed as annuluses when viewed on a plane. Conservation of momentum requires that the sum of the wave vectors for these resulting output photons be equal to that of the input pump photon.
To simplify the calculations, let's look at the collinear case of SPDC, where the pump, signal, and idler photons are all propagating in the same direction. In this case, both the energy and momentum conservation relations simplify to scalar equations:
and
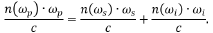
Here, ω represents the angular frequency of the photon and k the magnitude of the wave vector. The indices p, s, and i stand for pump, signal, and idler, respectively. The frequencies and wavevectors of each of these three photons are not independent but linked via the expression
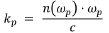
where n(ωp) is the frequency-dependent index of refraction of the crystal at the pump frequency ωp, and c is the speed of light in vacuum. The signal and idler photons have analogous relations which together allow for the conservation of momentum expression to be rewritten as:
Degenerate SPDC
For the further simplifying case of degenerate SPDC, we can assume the wavelength (and thus frequency ω) of the signal and idler photons are the same and thus the previous expression simplifies to:

where (ωs,i) is the frequency of the degenerate signal and idler photons. Since ωp = 2 (ωs,i) for energy conservation, this demonstrates that we need the same index of refraction for both the short-wavelength pump and long-wavelength signal/idler photons, i.e. n(ωp) = n(ωs,i). This can be accomplished through the use of birefringent crystals, which have different indices of refraction for different polarizations of light. The crystal orientation can be rotated with respect to the input polarization of the pump beam to create the appropriate phase matching conditions to conserve energy and momentum and allow for spontaneous parametric down conversion.
Categories of SPDC
Stepping back from the simple case above, SPDC can be broken down into three categories all dealing with how the process is phase matched: collinear vs non-collinear wavevector orientations, type-0 versus t
Additional discussion on the SPDC categories and tuning between them is found below in the How is the SPDC process tuned in homogeneous nonlinear crystals? section.
Can all crystals be used for SPDC?
Only optical materials which have a non-zero χ(2) parameter support SPDC, and not all crystals fulfill this requirement. An example of a crystal that can be used for SPDC is β-BBO. A material is crystalline when its atoms, ions, or molecules are arranged in a repeating pattern. If there is no central point around which the crystal pattern is symmetric (i.e. if the crystal is not centrosymmetric), the crystal has a non-zero χ(2) parameter and can be used for SPDC.

Click to Enlarge
Figure 4.6 When light's oscillating electric field interacts with a centrosymmetric material, an electron's induced potential energy, which is illustrated as a function of the electron's displacement (x) from its equilibrium position, is symmetric and described by a polynomial function consisting of even powers of x.
Click to Enlarge
Figure 4.5 This cubic crystal structure includes two different ions, A and B, in a repeating pattern. The crystal structure is centrosymmetric since the crystal at point (x, y, z) and its inverse (-x, -y, -z) are identical.
Click to Enlarge
Figure 4.8 When light's oscillating electric field interacts with a non-centrosymmetric material, an electron's induced potential energy, which is illustrated as a function of the electron's displacement (x) from its equilibrium position, is asymmetric for larger displacements. This curve is described by a polynomial function consisting of even and odd powers of x.
Click to Enlarge
Figure 4.7 This wurtzite crystal structure includes two different ions, A and B, in a repeating pattern. The crystal structure is not centrosymmetric since there is at least one point (u, v, w) which is not identical to its inverse (-u, -v, -w).
Centrosymmetric Crystal
The repeating crystalline pattern of one type of centrosymmetric crystal is illustrated in Figure 4.5. As is true for all centrosymmetric crystals, the structure at point (x, y, z) is identical to the structure at the inverse location (-x, -y, -z). Due to the crystal's structural symmetry, the material's response is the same whether the incident light's electric field vector points in one direction or in the opposite direction.
The material’s response to light occurs due to interactions between the light’s oscillating electric field and the electrons in the material. An electron bound to an atom in the material experiences forces contributed by the atom and the light’s electric field, as well as the surrounding atoms in the material. The blue curve in Figure 4.6 was calculated using the Lorentz model of an atom, which takes these forces into account using a classical mechanics approach. This model can also be used to estimate the χ(2) parameter.
In Figure 4.6, the X-axis corresponds to the position of the electron, which is in equilibrium at x = 0. The input light’s oscillating electric field moves the electron back-and-forth between positive and negative displacements. The greater the intensity of the electric field, the larger the displacement of the electron. The central and surrounding atoms exert a restoring force on the displaced electron, returning it to equilibrium. This restoring force provides the electron with potential energy, which is plotted on the Y-axis and increases as the electron moves further from equilibrium.
At moderate displacements, the central atom exerts the majority of the restoring force, and the electron’s corresponding potential energy is symmetric and approximately parabolic (the dashed gray curve is a parabolic fit). At larger displacements, achieved using higher-intensity light, surrounding atoms contribute more to the restoring force, as well as the electron’s potential energy. At these larger displacements, the electron’s potential energy deviates from parabolic but remains symmetric.
The symmetric material response is a consequence of the centrosymmetric structure of the crystal. In order to support SPDC, this curve would have to be asymmetric. Mathematically, a non-zero χ(2) parameter requires the polynomial describing the curve to include odd powers of x, while the polynomial describing the curve in Figure 4.6 includes only even powers of x.
Non-Centrosymmetric Crystal
An example of a non-centrosymmetric material is shown in Figure 4.7. In the case of these materials, there is aways at least one location (u, v, w) for which the crystal structure differs from the crystal structure at the inverse location (-u, -v, -w).
The potential energy of an electron, as a function of its displacement from its equilibrium position, has been calculated for a non-centrosymmetric material using the Lorentz model of the atom (Figure 4.8). When the incident light has low intensity, the displacement of the electron from its equilibrium position is small, and the majority of the restoring force is provided by the central atom. Within this limited region, the electron's corresponding potential energy function is symmetric and approximately parabolic, which indicates a linear optical material response. When illuminated by higher-intensity light, the electron's displacement is greater and the surrounding atoms contribute more to the restoring force. Since the distribution of the surrounding atoms is not symmetric, neither is the restoring force nor the potential energy well confining the electron for these higher displacements.
The polynomial needed to model this asymmetric curve includes even, as well as odd, powers of x. It is the non-zero cubic (x3) terms in this polynomial that provide a non-zero χ(2) parameter. A third-order polynomial term is required for the generation of the second-order nonlinearities quantified by the χ(2) parameter, since the x3 term is the lowest-order correction to the linear optics model. Because the asymmetric response only becomes significant for larger electron displacements, high-intensity light is required to induce SPDC.
Uniaxial Crystal
A secondary requirement for efficient production of light through nonlinear processes, which will be discussed in a section below, is the so-called phase matching condition. At a high level, phase matching is the conservation of momentum between the input and output photons of the nonlinear process. This is frequently accomplished by utilizing the birefringence of anisotropic optical materials.
Uniaxial crystals are a specific type of anisotropic material, where two of the three principal refractive indices are the same. The name “uniaxial” is derived from there being a single propagation axis in these crystals, known as the optical axis or c-axis, on which the index of refraction is the same for all polarization orientations. Many common optical materials belong to the uniaxial class: calcite, quartz, sapphire, and β-BBO.
Reference:
Robert W. Boyd, Nonlinear Optics (Academic Press, New York, 1992) pp. 17 - 52.
Can a crystal's refractive index depend on the light's polarization orientation within the crystal?
Certain materials have a refractive index that depends on the orientation of the light's electric field polarization. An example is birefringent materials, which include uniaxial crystals like β-BBO. Uniaxial crystals characteristically have two principal refractive indices, which are called the ordinary (no) and extraordinary (ne) refractive indices. The principal refractive indices are the maximum and minimum the material can provide. Since light’s electric field (E) is always polarized perpendicular to the propagation direction (k), both the propagation direction and polarization state must be known to determine the refractive indices experienced by the light's polarization components.
A Cartesian coordinate system, with the Z-axis aligned along the crystal’s optic axis (c), can be used to relate the light's polarization components (Ex, Ey, and Ez) to a birefringent crystal's geometry.
In uniaxial crystals, the refractive index can be determined by referencing the angles of the propagation direction and polarization orientation relative to the crystal's optic axis (c).
Since the crystal is uniaxial, the refractive index for fields polarized orthogonal to the crystal's optic axis is no. For fields parallel to the crystal's optic axis, the refractive index is ne. The two components (Ex and Ey) of light polarized orthogonal to the crystal's optic axis have refractive indices equal to no, since the crystal is uniaxial. Light polarized parallel (Ez) to the crystal’s optic axis has a refractive index equal to ne.
It is also possible for birefringent materials to provide a refractive index value between no and ne, which is discussed in a following section.
Click to Enlarge
Figure 4.9 The diagram on the left indicates the propagation direction (k) of the incident light is along the optic axis (c) of the crystal. The incident light can be decomposed into orthogonal polarization components Ex and Ey. The diagram on the right is a refractive index ellipsoid, with a conic section (red circle) at the XY-plane. This constant-radius circle shows the refractive index is always no in this case and the crystal does not affect the light's polarization.
Light Propagating Parallel to the Optic Axis
(Example: Optical Windows)
Light propagating along the optic axis (Z-axis) of a birefringent material always has a refractive index equal to no. This is a defining trait of the optic axis.
The left side of Figure 4.9 illustrates the electric field components of light propagating along the crystal's optic axis. These polarization state components can include Ex and Ey, but not Ez. In other words, the electric field vector is orthogonal to the Z-axis, so the angle φ equals 90°. The relative magnitude of Ex and Ey depends on angle α.
The right side of Figure 4.9 uses an ellipsoidal volume, the so-called index ellipsoid, to map all possible refractive indices provided by the material for all combinations of light propagation directions and polarization orientations. In the case of this material, the maximum possible refractive index is ne and the minimum is no. The opposite can be true for other materials. The red circle drawn on the ellipsoid is a conic section that marks the refractive indices that light propagating along the optic axis will experience. The refractive index of both Ex and Ey components equals no. Due to this, E has a refractive index of no, regardless of the orientation of the E vector in the XY-plane. Therefore, the Ex and Ey components travel with the same phase velocity, and the polarization state stays the same as the light propagates.
Optical windows made from uniaxial crystals, such as sapphire (for example Item # WG31050), are typically cut or polished so that normally incident light propagates parallel to the optic axis. This is done so that the window has no effect on the polarization state of the transmitted light, as described above. When the end faces are orthogonal to the optic axis like this, the crystal is often described as Z-cut or C-cut.

Click to Enlarge
Figure 4.10 The diagram on the left indicates the incident light's propagation direction (k) and polarization state orientation (E), which can be decomposed into orthogonal components Ex and Ez. The propagation direction is aligned to the Y-axis and is orthogonal (θ = 90°) to the optic axis (c) of the crystal. The diagram on the right is a refractive index ellipsoid, with conic sections (red ellipses) drawn in the XZ- and XY-planes. The refractive index (ne) of the extraordinary component (Ee = Ez) is indicated by the intersection of the Z-axis and ellipse, while the refractive index (no) of the ordinary component (Eo = Ex) is indicated by the intersection of the X-axis and the ellipse. The angle φ determines the two components' relative magnitudes.
Click to Enlarge
Figure 4.11 The diagram on the left indicates the incident light's propagation direction (k), which is aligned to the Y-axis, which is orthogonal (θ = 90°) to the optic axis (c) of the crystal. Since φ is 0°, the only polarization component is Ez, which is also the extraordinary component. The diagram on the right indicates this component has a refractive index of ne.
Click to Enlarge
Figure 4.12 The diagram on the left indicates the incident light's propagation direction (k), which is aligned to the Y-axis, which is orthogonal (θ = 90°) to the optic axis (c) of the crystal. Since φ is 90°, the only polarization component is Ex, which is also the ordinary component. The figure on the right indicates this component has a refractive index of no.
Light Propagating Perpendicular to the Optic Axis
(Example: Wave Plate)
When linearly polarized light incident on a birefringent material propagates in a direction orthogonal to the optic axis (θ = 90°), the light may have components polarized both parallel and perpendicular to the optic axis (Z-axis). This is illustrated in Figure 4.10, in which the light’s propagation direction is aligned to the Y-axis for convenience. The refractive index of the electric field component parallel to the optic axis (Ez) is ne, and the component perpendicular to the optic axis (Ex) is no. This is the largest refractive index difference that can exist between two polarization components in the material.
The vertical, red circle on the right side of Figure 4.10 is the conic section of the index ellipsoid in a plane perpendicular to the k-vector. The horizontal, red elliptical conic section indicates a difference between the refractive indices of the orthogonal principal polarization axes of ![]() and
and ![]() .
.
Due to different refractive indices, the two polarization components travel at different velocities as they propagate through the material. This causes a phase shift between the two polarization states Ez and Ex.
Wave plates are often fabricated from uniaxial birefringent materials, with the optic polished and mounted so that normally incident light propagates orthogonal to the optic axis. Markings on the wave plate housing, such as the ones on Item # WPQ05M-266, or flat features on the perimeter of the optic, identify the orientations of the ordinary and extraordinary axes, or for a typical waveplate made of crystal quartz the so-called fast and slow axes, respectively.
Light polarized parallel to the fast axis travels with a faster velocity in the material due to the lower refractive index, compared with light polarized parallel to the slow axis. Quartz, a commonly used waveplate material, is a positively uniaxial crystal with a smaller ordinary refractive index compared to its extraordinary index. For quartz, the fast axis is the ordinary axis.
Tuning a wave plate requires rotating the optic in the XZ-plane, around the Y-axis, so that the light's propagation direction is maintained perpendicular to the optic axis. This rotation changes the angle φ, while keeping θ = 90°.
When the angle φ is between 0° and 90°, the linear polarization state has both orthogonal Ex and Ez components, and the wave plate will delay one component relative to the other. However, note that since θ is unchanged, there is no change in the indices of refraction of the two principal orthogonal polarization orientations along ![]() and
and ![]() .
.
When φ = 0°, as illustrated in Figure 4.11, the light's polarization state is oriented along the optic axis. This provides an extraordinary component (Ez = Ee) without an ordinary component. This component has a refractive index equal to ne. Since there is only one polarization component, the wave plate does not affect the polarization state.
The polarization state is similarly unaffected when the linear polarization state is aligned with the X-axis (φ = 90°), as seen in Figure 4.12. In this case, there is an ordinary component (Ex = Eo) without an extraordinary component and the refractive index is no.
Click to Enlarge
Figure 4.13 In the diagram on the left, the propagation direction (k) of the incident light and the optic axis (c) of the uniaxial birefringent crystal are in the same plane (XZ plane). The angle (θ) between k and c is arbitrary. The input fundamental field, represented by the red vector, is parallel to the Y-axis. The SHG light is polarized perpendicularly, represented by the green vector in the XZ plane. Rather than decompose the SHG polarization into components Ex and Ez, the light is typically described as an extraordinary wave (E'e) with a refractive index, n'e. In the diagram on the right, n'e, which depends on θ, is indicated by the intersection of the conic section illustrated by the red ellipse with the XZ plane.
Click to Enlarge
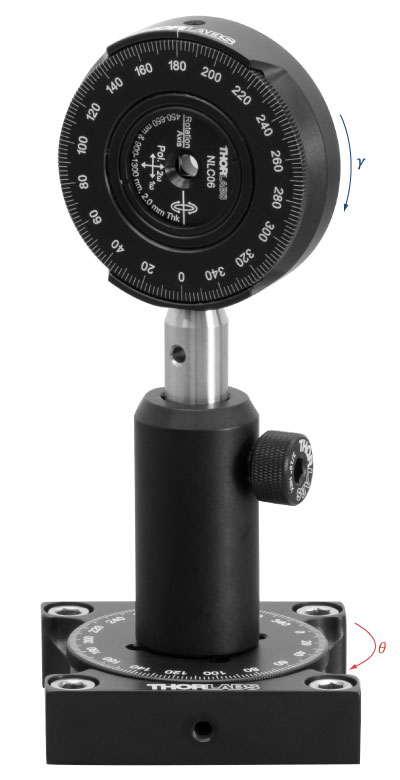
Figure 4.15 How θ and γ are defined in a laboratory setup.
Click to Enlarge
Figure 4.14 In the diagram above, the propagation direction (k) of the incident light and the optic axis (c) of the uniaxial birefringent crystal are in the same plane (XZ-plane). The angle (θ) between k and c is arbitrary. In this case, the incident fundamental field (E), represented by the red vector, is rotated off of the laboratory reference frame by an angle γ, and thus only a portion of the fundamental (Eoγ) is converted by SHG into the resulting polarization E'e, represented by the green vector.
Light Propagating at an Arbitrary Angle
(Example: Nonlinear Crystals)
This is a case study using type-I second harmonic generation (SHG) as an example of an application of birefringent crystals in nonlinear optics. SHG is the reverse case of degenerate SPDC, so this treatment will be instructive.
In uniaxial crystals, the field polarizations are arranged as in Figure 4.13 for type-I second harmonic generation (SHG). The k-vector is at an angle θ from the optic axis, ![]() , and in the XZ plane. The input fundamental electric field (Eo) is polarized parallel to one of the principal ordinary axes, in this case the Y-axis, and has a refractive index of no. The index of refraction for light polarized in the ordinary direction, parallel to
, and in the XZ plane. The input fundamental electric field (Eo) is polarized parallel to one of the principal ordinary axes, in this case the Y-axis, and has a refractive index of no. The index of refraction for light polarized in the ordinary direction, parallel to ![]() , is independent of changes to θ.
, is independent of changes to θ.
The SHG light is polarized in the XZ plane and is orthogonal to both the Eo and the k-vector. Rather than decompose the polarization of the SHG light into Ex and Ez components, the electric field is typically described as an extraordinary wave (E'e). The refractive index for this extraordinary wave, n'e, changes as a function of θ. n'e(θ) can be calculated using the equation in Figure 4.13. The ellipse defining the extraordinary index of refraction as a function of θ is a conic section of the index ellipsoid. The two extreme cases are 1) θ = 0°, where the field is polarized along the other principal ordinary axis, ![]() , and the index of refraction is no, or 2), θ = 90°, where the field is polarized along the principal extraordinary axis,
, and the index of refraction is no, or 2), θ = 90°, where the field is polarized along the principal extraordinary axis, ![]() , and the index of refraction is ne. The prime (') notation is used to denote index of refraction for cases in between the two extreme cases of θ.
, and the index of refraction is ne. The prime (') notation is used to denote index of refraction for cases in between the two extreme cases of θ.
Figure 4.14 shows a departure from an ideal polarization orientation for type-I SHG, where the incident fundamental field has a linear polarization but is rotated by a degree γ from the principal ordinary axis ![]() . The fundamental field now driving the type-I SHG process is the Eoγ component of the incident field. At γ = 90°, there would be zero SHG output, since the drive field Eoγ = 0.
. The fundamental field now driving the type-I SHG process is the Eoγ component of the incident field. At γ = 90°, there would be zero SHG output, since the drive field Eoγ = 0.
In practice, γ is nonzero when the polarization states of light in a laboratory reference frame are not matched to the intrinsic principal axes in the crystal frame. To orient the two reference frames together, e.g. the vertically polarized light from the laser on the optical table is parallel to ![]() in the crystal, we mount the nonlinear crystal in a rotation stage to finely adjust γ to zero, first by eye using the markings on the housing and then further, if necessary, using the SHG output power as feedback. Figure 4.15 shows the orientation of γ in a laboratory frame rotation of the crystal. In this example case, the nonlinear crystal is mounted in an RSP1 rotation mount on top of an RP01 rotation stage. Changes in γ and θ adjust the orientation of the optic axis,
in the crystal, we mount the nonlinear crystal in a rotation stage to finely adjust γ to zero, first by eye using the markings on the housing and then further, if necessary, using the SHG output power as feedback. Figure 4.15 shows the orientation of γ in a laboratory frame rotation of the crystal. In this example case, the nonlinear crystal is mounted in an RSP1 rotation mount on top of an RP01 rotation stage. Changes in γ and θ adjust the orientation of the optic axis, ![]() . In this case, adjustments in γ have been used to align
. In this case, adjustments in γ have been used to align ![]() with the horizontal plane and one of the principle ordinary axes vertically. For a vertically polarized input beam, this orientation allows the rotation stage to be used to adjust θ.
with the horizontal plane and one of the principle ordinary axes vertically. For a vertically polarized input beam, this orientation allows the rotation stage to be used to adjust θ.
How is the SPDC process tuned in homogeneous nonlinear crystals?
Click to Enlarge
Figure 4.15 The signal and idler photons emitted during noncollinear spontaneous parametric down conversion form either a cone (type-I SPDC) or a pair of cones (type-II SPDC). The two intersection lines between the signal and idler emission cones in type-II SPDC (labeled ks and ki, respectively) are the wavevectors that can correspond to polarization entangled photons. This type-II SPDC diagram shows noncollinear SPDC emission, but collinear emission with a gaussian profile is also possible.

Click to Enlarge
Figure 4.16 For SPDC, it is necessary for the pump and signal/idler photons to experience the same index of refraction despite their different wavelengths. Birefringent materials like β-BBO allow for this by having different indices of refraction for two crystal axes so that photons with different polarizations and different wavelengths can be phase matched.
Tuning Type-I, Degenerate, Non-Collinear SPDC
In the following example, degenerate non-collinear spontaneous parametric down conversion (SPDC) with a 405 nm pump is used to demonstrate how tuning is performed. Using the same logic, degenerate and non-degenerate SPDC tuning can be achieved for any pump wavelength. This example, where the degenerate signal and idler have the same polarization, perpendicular to that of the pump, is called type-I SPDC, as shown in the upper panel of Figure 4.15. In contrast, for type-II SPDC, the signal and idler have polarizations perpendicular to each other, with one being parallel to the pump polarization, as shown in the lower panel of Figure 4.15.
As discussed previously, for SPDC to occur, the index of refraction within the nonlinear crystal for the pump at 405 nm must be the same as the index of refraction for both the signal and idler at 810 nm. The refractive index as a function of wavelength for β-BBO is shown in Figure 4.16. The red solid curve indicates the refractive index for the ordinary beam (no). The black dashed curve is the refractive index for the extraordinary beam (ne) if the input beam is orthogonal to the crystal plane. By rotating the crystal axes relative to the wavevector of the incident pump, the refractive index curve can be moved until ne (405 nm, pump) = no (810 nm, signal/idler). This is called phase matching and allows for efficient SPDC from pump photons at 405 nm to signal and idler photon pairs at about 810 nm each. In this example, the optic axis of the crystal must be at an angle of 29.2° relative to the incident 405 nm pump beam to allow for optimal phase matching. Typically, a crystal cut to a similar angle (like our NLCQ1, NLCQ2, or NLCQ3 crystals for this example) would be used to allow for near-normal incidence and maximizing of the clear aperture.
Thorlabs' β-BBO crystals are designed to provide near-phase-matched conditions for normally incident input light for a specified set of wavelengths. The faces of the β-BBO crystals are cut such that the angle between the normally incident light and the optic axis is approximately the phase-matching angle for the specified frequencies. See the Specs tab for detailed specifications for the crystals currently available. The phase matching angle can be tuned by rotating the crystal to alter the angle between the optical axis (OA) and the incident pump as shown in Figure 4.15. An adjustment of typically only a few degrees can either optimize the performance of the crystal in the setup or match another wavelength within the crystal's operating range.
Tuning Between Type-I and Type-II SPDC
Depending on the exact phase matching parameters, the signal and idler photon pairs either leave the crystal either collinearly with the same mode as the pump beam, or non-collinearly on a cone with a small opening angle. The angle of the cone and wavelengths of the signal/idler pair can be tuned by adjusting the angle of incidence to the crystal.
For type-I SPDC (see the upper panel of Figure 4.15), in the specific example discussed above, the degenerate noncollinear signal and idler photons emit in a singular annular cone with a half angle of 2.88°. Rotating the crystal's optical axis to an angle of 28.64° changes the degenerate phase matching condition from non-collinear to collinear, collapsing the conical emission pattern to a Gaussian spatial mode collinear with the pump.
Due to the large difference in angle between type-I and type-II SPDC, it is often necessary to use crystals with different cut angles. For example, Thorlabs' NLCQ1 β-BBO crystal is cut at 29.2° to enable type-I phase matching with a 405 nm pump and degenerate 810 nm output at near-normal incidence. For type-II SPDC at the same wavelengths, Thorlabs' NLCQ4 BBO crystal cut at 41.8° would allow for phase matching at near normal incidence.
For type-II SPDC (see the lower panel of Figure 4.15), the signal and idler have distinct noncollinear emission cones each with a half angle of 5°. The signal and idler emission cones are separated from each other by a half angle of 1.7°. This results in the two cones intersecting at two lines. For larger increased negative angular offset (larger optic axis angle relative to the pump propagation), the individual cone half angles increase but the separation is relatively un-changed. Due to the increased cone half angle, the intersection lines of the two emission cones move outwards (transverse). As the AOI is tuned towards the collinear case, the two noncollinear annular emission cones separate and then collapse back to the collinear Gaussian modes.
It is important to note that for a pump wavelength of 405 nm, the wavelength of the signal and idler photons will not always be exactly 810 nm. It is also allowed that photon pairs can be of differing wavelengths, such as 812 nm and 808 nm. In those cases, the photon with the longer wavelength (lower energy) makes a slightly larger angle with the pump beam and vice versa. This wavelength deviation is limited by how well the phase matching is fulfilled at the different wavelengths, as the efficiency of the SPDC process will drop sharply with non-optimal phase matching.
The broad phase matching criteria for these crystals allows for photon pairs to be emitted under a vast range of wavelengths and angles. This means that photons generated by SPDC are distributed over a large spatial region. When measuring with two detectors in coincidence, one must be careful that detectors are positioned in the correct location so that they are able to detect photons from the same signal/idler pair.
The Effect of Crystal Thickness on SPDC
While phase matching can be achieved with a wide variety of wavelengths, crystals, and geometries, optimizing the system for the desired output introduces many more variables that should be considered. One such factor is the thickness of the crystal. Thicker crystals can provide a higher photon pair generation rate for a given pump power as there is a longer path for the light to interact with the crystal. However, increasing thickness also blurs the wavelength-position correlation of the SPDC photons, as pairs created at different spots in the crystal have different points of origin for the cone on which they are emitted. In type-II SPDC, the birefringent material of β-BBO causes differing group velocities in the ordinary and extraordinary axes due to different indices of refraction, causing temporal walk-off between the perpendicularly polarized signal and idler photons. This effect acts to label the signal and idler photons, reducing the quality of entanglement. As this temporal walk-off is a propagation effect, it scales linearly with increasing crystal thickness.
Thicker crystals also tighten the pump bandwidth for a given set of phase matching conditions as seen in Figure 4.17. More consequentially, the thicker crystals also result in tighter angular bandwidth for the emitted signal and idler photons, see Figure 4.18. This tighter angular distribution reduces the wavelength-position correlation and can make it more challenging to isolate specific photon pairs, since in an actual experiment an iris is typically used to spatially filter the output signal and idler beams, thus passing a more restricted range of wavelengths.

Click to Enlarge
Figure 4.17 As crystal thickness increases, the pump bandwidth that is phase-matched gets narrower. In this series of calculations, a fixed output wavelength was chosen and the resulting pump wavelengths that can achieve phase matching are plotted. This theoretical data was calculated with the web tool SPDCalc.
Click to Enlarge
Figure 4.18 The angular dispersion of the emitted signal and idler photons becomes tighter with increasing crystal thickness. This theoretical data was calculated with the web tool SPDCalc.
How is the SPDC process tuned in periodically poled nonlinear crystals?
Click to Enlarge
Figure 4.19 Quasi-phase matching is achieved in periodically poled materials by repeatedly inverting the crystal domain orientation at the length that maximizes constructive interference between the newly generated photons and the previously generated photons from earlier in the crystal. The optimal poling period depends on the crystal properties as well as the wavelengths of the pump, signal, and idler photons. In a non-phase matched crystal, the generated photons build up and then decay, while in a quasi-phase matched crystal, the generated photons build up to a local maximum, the domain is inverted and buildup occurs again to a next maximum, and the process repeats itself, leading to a continual buildup of generated photons.
Phase Matching and Quasi-Phase Matching
Different crystals used for SPDC are designed for different methods of phase matching. Traditional phase matching is performed for homogeneous birefringent crystals, which have different indices of refraction for different polarizations of light. The crystal orientation can be rotated with respect to the input polarization of the pump beam to create the appropriate phase matching conditions to conserve energy and momentum and allow for nonlinear processes like SHG, SFG, or SPDC to be optimally efficient. In quasi-phase matching, the crystal itself is engineered through periodic poling to correct for the differing phases within the material instead of by tuning the angle of incidence.
By designing a crystal such that a photon passing through will experience a periodic reversal of the crystal’s polarity, at a particular wavelength, this will allow the generation of SPDC photons to build constructively over the path length through the crystal, as illustrated in Figure 4.19.
Tuning Type-0 and Type-II, Degenerate, Collinear SPDC
This periodically poled crystal structure allows for type-0 SPDC, which was not achievable in homogenous crystals. Figure 4.20 illustrates the difference in signal and idler outputs between our periodically poled nonlinear crystals that are designed for type-0 or type-II SPDC. The case where the degenerate signal and idler have the same polarization, parallel to that of the pump, is called type-0 SPDC, as shown in the upper panel of Figure 4.20. In contrast, for type-II SPDC, the signal and idler have polarizations perpendicular to each other, with one being parallel to the pump polarization, as shown in the lower panel of Figure 4.20.
Click to Enlarge
Figure 4.20 The signal and idler photons emitted during collinear spontaneous parametric down conversion have polarization aligned either parallel to the pump photons (type-0) or with the signal perpendicular to the pump and the idler parallel to the pump (type-II).
Thorlabs' periodically poled potassium titanyl phosphate (PPKTP) crystals are designed for quasi-phase matching with the crystal temperature around 60 °C and either a pump wavelength around 405 nm (for Item #s NLCK1 and NLCK2) in order to efficiently produce degenerate SPDC photons at around 810 nm, or a pump wavelength around 775 nm (for Item #s NLCK3 and NLCK4) for SPDC at around 1550 nm.
Tuning Degeneracy in Quasi-Phase Matched SPDC Crystals
As an example, let's look at some data for the case of degenerate collinear SPDC with a 405 nm pump to demonstrate how tuning is performed. Using the same logic, degenerate and non-degenerate SPDC tuning can be achieved for any pump wavelength. It is important to note that for a pump wavelength of 405 nm, the wavelength of the signal and idler photons will not always be exactly 810 nm. It is also allowed that photon pairs can be of differing wavelengths, such as 812 nm and 808 nm, which is known as non-degenerate SPDC. The resulting wavelengths of the signal and idler photons in quasi-phase matched crystals are determined by the pump laser wavelength and the temperature of the crystal. Figure 4.21 shows the temperature dependence of the SPDC photon wavelengths for different pump wavelengths in type-0 crystals while Figure 4.22 shows this dependence for type-II crystals.
The Effect of Crystal Thickness on SPDC in Periodically Poled Crystals
As mentioned previously, longer crystals can provide a higher photon pair generation rate for a given pump power as there is a longer path for the light to interact with the crystal. However, increasing thickness also decreases the spectral phase-matching bandwidth, affecting the range over which quantum photon correlation effects can be observed. Periodically poled crystals are designed to limit group velocity walk-off between the pump, signal, and idler photons, leading to efficient SPDC.
Click to Enlarge
Figure 4.21 In our type-0 PPKTP nonlinear crystals, temperature can be adjusted to accommodate degeneracy with a different pump wavelength or to tune the SPDC away from degeneracy and produce two SPDC photons with different wavelengths.
Click to Enlarge
Figure 4.22 In our type-II PPKTP nonlinear crystals, temperature can be adjusted to accommodate degeneracy with a different pump wavelength or to tune the SPDC away from degeneracy and produce two SPDC photons with different wavelengths.
フェムト秒パルスレーザ用ならびにピコ秒レーザ用光学素子を幅広くご用意しています。詳細は下表をご参照ください。
| Dielectric Mirror | High-Power Mirrors for Picosecond Lasers | Metallic Mirrors | Low-GDD Pump-Through Mirrors | ||
|---|---|---|---|---|---|
 |  |  |  |  |  |
| Dual-Band Dielectric Mirror, 400 nm and 800 nm | Ytterbium Laser Line Mirrors, 250 nm - 1080 nm | Ultrafast-Enhanced Silver Mirrors, 750 - 1000 nm | Protected Silver Mirrors, 450 nm - 20 µm | Unprotected Gold Mirrors, 800 nm - 20 µm | Pump-Through Mirrors, 1030 - 1080 nm and 940 - 980 nm |
| Deterministic GDD Beamsplitters | Low-GDD Harmonic Beamsplitters | Low-GDD Polarizing Beamsplitters | β-BBO Crystals | Dispersion-Compensating Optics | |
|---|---|---|---|---|---|
 |  |  |  |  |  |
| Beamsplitters & Windows, 600 - 1500 nm or 1000 - 2000 nm | Harmonic Beamsplitters, 400 nm and 800 nm or 500 nm and 1000 nm | High-Power, Broadband, High Extinction Ratio Polarizers, 700 - 1300 nm | β-BBO Crystals for Second Harmonic Generation | Dispersion-Compensating Mirrors, 650 - 1050 nm | Dispersion-Compensating Prisms, 700 - 900 nm |
| Posted Comments: | |
| No Comments Posted |

 ズーム
ズーム| Key Specifications for SPDC Applicationsa | ||||
|---|---|---|---|---|
| Item # | NLCK1 | NLCK2 | ||
| Crystal Length | 30.00 mm | |||
| Max Operating Temperature | 120 °C | |||
| Application | Type-0 SPDC | Type-II SPDC | ||
| AR Coating (AOI = 0°) | R < 0.5% at 405 and 810 nm | |||
| AR Coating Curve | Raw Data | |||
| Pump Wavelength (2ω) | T = 60 °C | 405 nm | ||
| SPDC Signal / Idler Wavelength (1ω) | T = 60 °C | 810 nm | ||
- 405 nmおよび810 nmのARコーティングが施されたマウント済みの結晶
- 60 °Cで励起光波長405 nmに対して810 nmのシグナル光・アイドラ光が得られるようにカット
こちらのPPKTP結晶は、中心波長405 nmの入射ビームから、Type-0またはType-IIの位相整合で810 nmのSPDC光が得られるように設計されています。60 °Cで縮退したSPDC光が得られるように設計されており、温度は非線形結晶用オーブン NLCH2/M(下記にて別売り)内に取り付けることで制御できます。励起レーザ光の波長が約404.5~406 nmの範囲内であれば、温度を60 °Cから少し変えて微調整することで、縮退SPDC光を生成することができます。温度調整についての詳細は「仕様」タブをご覧ください。これらの結晶の長さは30.00 mmで、励起およびシグナル・アイドラの各波長で表面反射が低減するようにARコーティングが施されています。このマウント付き結晶は、ナノ秒パルスレーザのNPL41Bのほか、半導体レーザのL405A1やDL5146-101Sなど、405 nmの出力光が得られるレーザを用いて励起することができます。

 ズーム
ズーム| Key Specifications for SPDC Applicationsa | ||||
|---|---|---|---|---|
| Item # | NLCK3 | NLCK4 | ||
| Crystal Length | 30.00 mm | |||
| Max Operating Temperature | 180 °C | |||
| Application | Type-0 SPDC | Type-II SPDC | ||
| AR Coating (AOI = 0°) | R < 0.5% at 775 and 1550 nm | |||
| AR Coating Curve | Raw Data |
|||
| Pump Wavelength (2ω) | T = 60 °C | 775 nm | ||
| SPDC Signal / Idler Wavelength (1ω) | T = 60 °C | 1550 nm | ||
- Mounted Crystal with Antireflection (AR) Coating for 775 nm and 1550 nm
- Cut for a 775 nm Pump Wavelength and 1550 nm Signal/Idler Wavelength at 60 °C
These PPKTP crystals are designed to produce 1550 nm type-0 or type-II SPDC emission from an input beam with a center wavelength of 775 nm. They are designed for degenerate SPDC at 60 °C and can be temperature-controlled by mounting in an NLCH2(/M) nonlinear crystal oven, sold separately below. Tuning the temperature away from 60 °C can accomodate degenerate SPDC with a range of pump laser wavelengths from approximately 774 - 780 nm for Item # NLCK3 or 765 -785 for Item # NLCK4, see the Specs tab for temperature tuning details. These crystals are 30.00 mm long and feature an AR coating to reduce surface reflections at the pump and signal/idler wavelengths. This mounted crystal can be pumped with lasers at around 775 nm such as our DBR780PN distributed Bragg reflector laser or our L780P010 diode laser.

 ズーム
ズーム| Specifications | ||
|---|---|---|
| Item # | NLCH2(/M) | |
| Crystal Length | Up to 30.00 mm | |
| Max Operating Temperature | 200 °C | |
| Clear Aperture | Ø0.18" (4.6 mm)a | |
| Beam Height | 1.00" (25.4 mm) | |
| Operating Voltage | 24 V | |
| Electrical Connection | 6-Pin Female Hiroseb | |
| Dimensions (H x W x D) | 1.87" x 2.51" x 2.50" (47.4 mm x 63.8 mm x 63.5 mm) | |
| Weight | 0.27 kg | |
| Recommended Controllerc | TC300B | |
- 周囲温度から200 °Cまで加熱可能
- 上記の非線形結晶PPKTPに対応
- 長さ30 mmまでの結晶の取付けが可能
- TC300B(別売り、下記参照)のような温度コントローラが別途必要
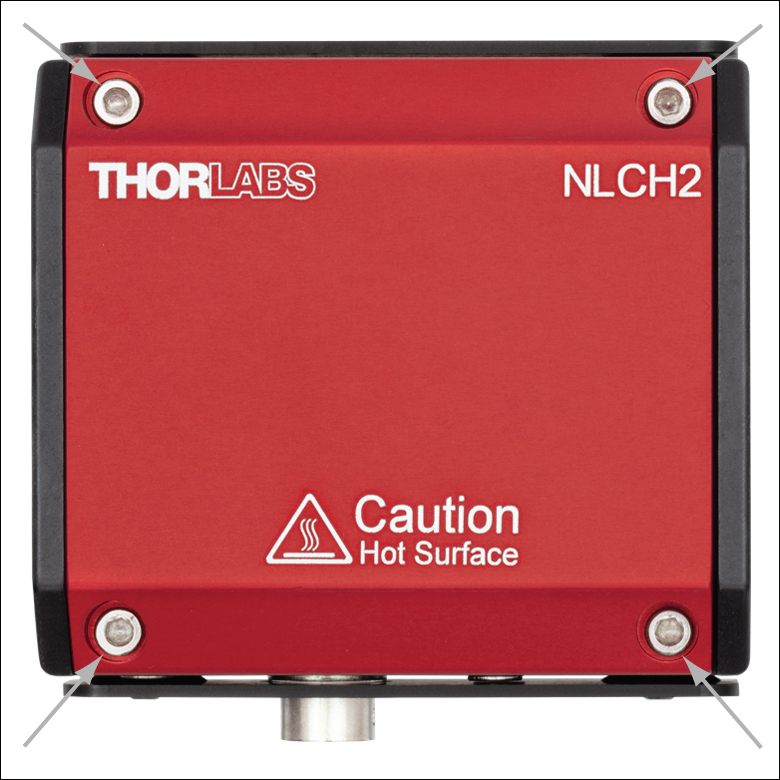
Click to Enlarge
Figure G3.1 オーブン上面の4本のネジを外してカバーを開くと、ヒーターデッキにアクセスできます。

Click to Enlarge
Figure G3.2 内部の2本のネジを外すと、オーブン内に非線形結晶を取り付けることができます。
この非線形結晶用オーブンNLCLH2/Mは、上記の非線形PPKTP結晶の温度を制御して安定化するように設計されています。PPKTP結晶を取り付けるには、まずFigure G3.1に示す4本のM2.5 x 0.45キャップスクリュを外し、オーブンのカバーを取り外します。続いて、Figure G3.2に示すオーブン内の2本のネジも外します。次に、結晶をオーブン内に置き、オーブン内の2本のØ2.0 mm位置決めピンに合わせます。最後に、先にオーブン内部から外した2本のキャップスクリュを使って結晶を固定します。
各オーブンの前面と背面には4つの#4-40ネジ穴があります。これらを用いて当社の30 mmケージシステムに取り付けられるため、光路に簡単に組み込むことができます。オーブンは当社の5軸ステージPY005/Mに直接取り付けることもできます。その際は、オーブン底面の2つのØ3.2 mm位置決めピン用穴(位置決めピンは付属していません)とステージ中央のM4ザグリ穴を使用します。オーブンを使用するには、当社のTC300B(別売り、下記参照)などの温度コントローラと、それに付属する6ピンHiroseコネクタの付いた接続用ケーブルが必要です。非線形結晶用オーブンについての詳細は製品紹介ページをご参照ください。
")
 ズーム
ズーム| Key Specificationsa | |
|---|---|
| Output Power per Channel | 48 W (Max) |
| Output Current per Channel | 2 A (Max) |
| Output Voltage per Channel | 24 V (Max) |
| Temperature Setting Range | -200 to 400 °Cb |
| Set Point Resolution | 0.1 °C / 0.001 °Cc |
| Temperature Stability | ±0.1 °C |
| Output Connector Type | Hirose HR10A-7R-6S(73) |
| USB Interface | USB 2.0 Type-B |
| Power Supply | 100 - 240 VAC, 50 - 60 Hz, 165 VA Max |
| Operating Temperature | 0 - 40 °C |
| Storage Temperature | -15 - 65 °C |
| Dimensions (H x W x D) | 86.6 mm x 154.3 mm x 327.8 mm (3.41” x 6.07” x 12.91”) |
| Weight | 1.7 kg |
- 温度制御の範囲:-200 °C~400 °C
- 単独操作またはソフトウェアによるPC制御
- プログラム可能なオートチューニング機能付きPID設定
ヒータ&TEC温度コントローラTC300Bは、48 Wまでの抵抗加熱素子および熱電冷却デバイス(TEC)を制御できる、2チャンネルのベンチトップ型コントローラです。上記の非線形結晶用オーブンに対しては、周囲温度から200 °Cまでの温度制御用にご使用いただけます。最高温度と電流/電圧リミット値はお客様ご自身で設定することができ、それにより接続した加熱素子のオーバーヒートやオーバードライブを防止できます。そのほかの安全機構として、温度センサが接続されていない時や断線している時にドライバをシャットダウンする、オープンセンサーアラームなどが付いています。
シンプルなキーパッドインターフェースを用いて単独で操作することが可能ですが、付属のUSB Type Bのケーブルを介してPCに接続し、TC300B用ソフトウェア、LabVIEW®*ドライバ、 LabWindowsドライバ、または簡単なコマンドラインインターフェイスを用いて制御することもできます。
コントローラTC300Bの機能についての詳細は、製品紹介ページをご覧ください。
*LabVIEW®はNational Instruments社の登録商標です。